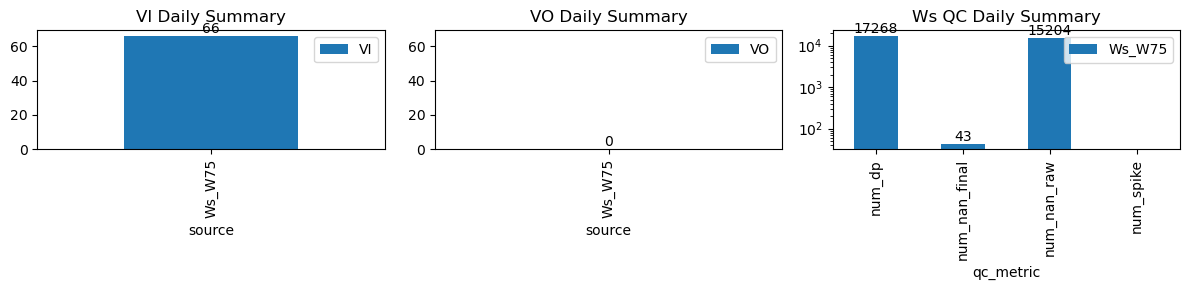
VI and VO Daily Summary
| ws_name | num_dp | num_nan_raw | num_nan_final | num_spike | cum_step_adj |
|---|---|---|---|---|---|
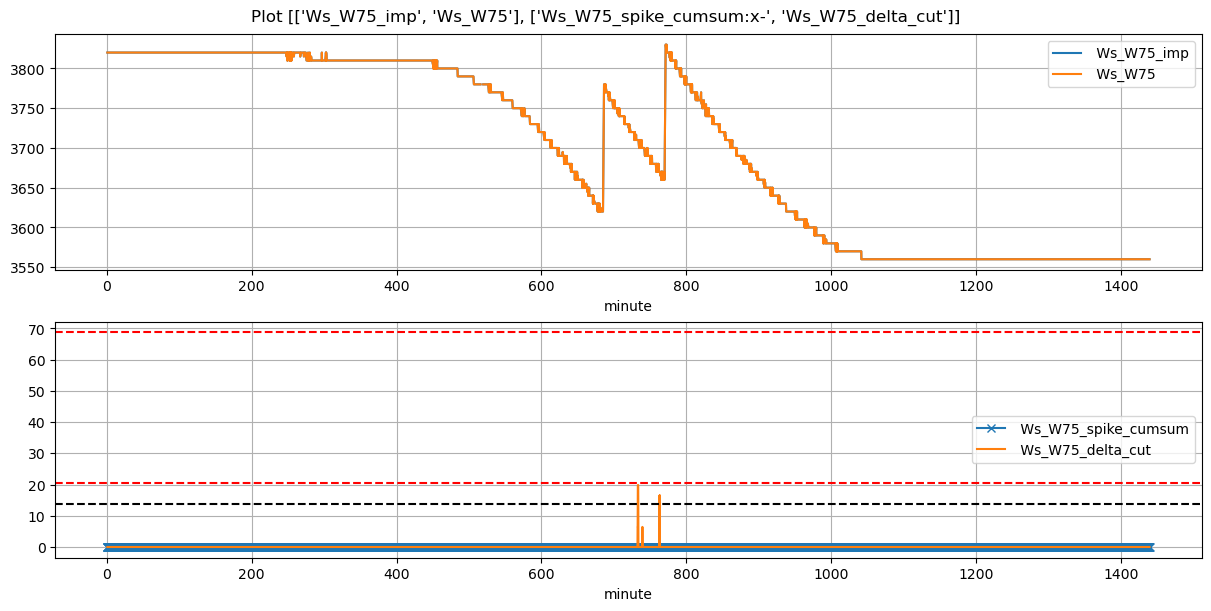
| Ws_W75 | 17,268 | 15,204 | 43 | 0 | 0.00 |
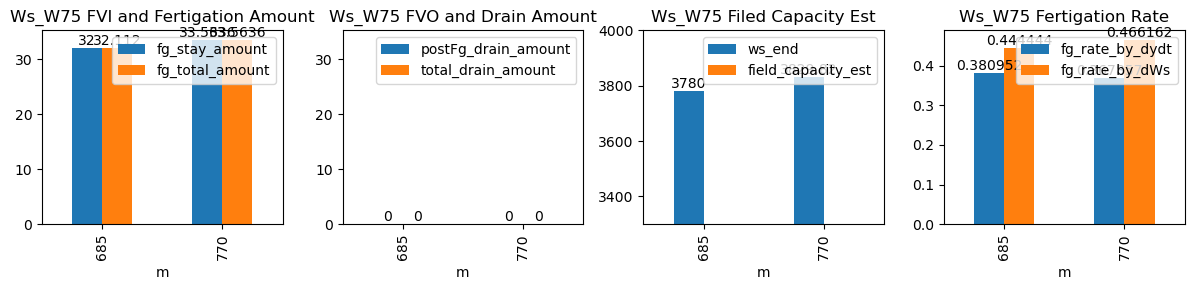
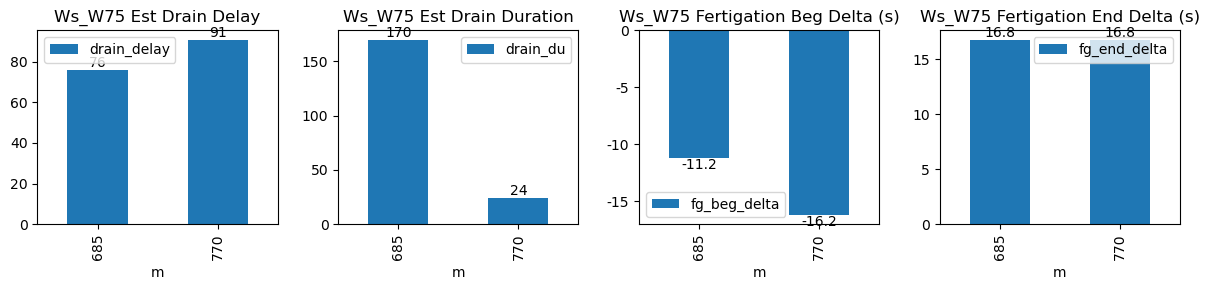
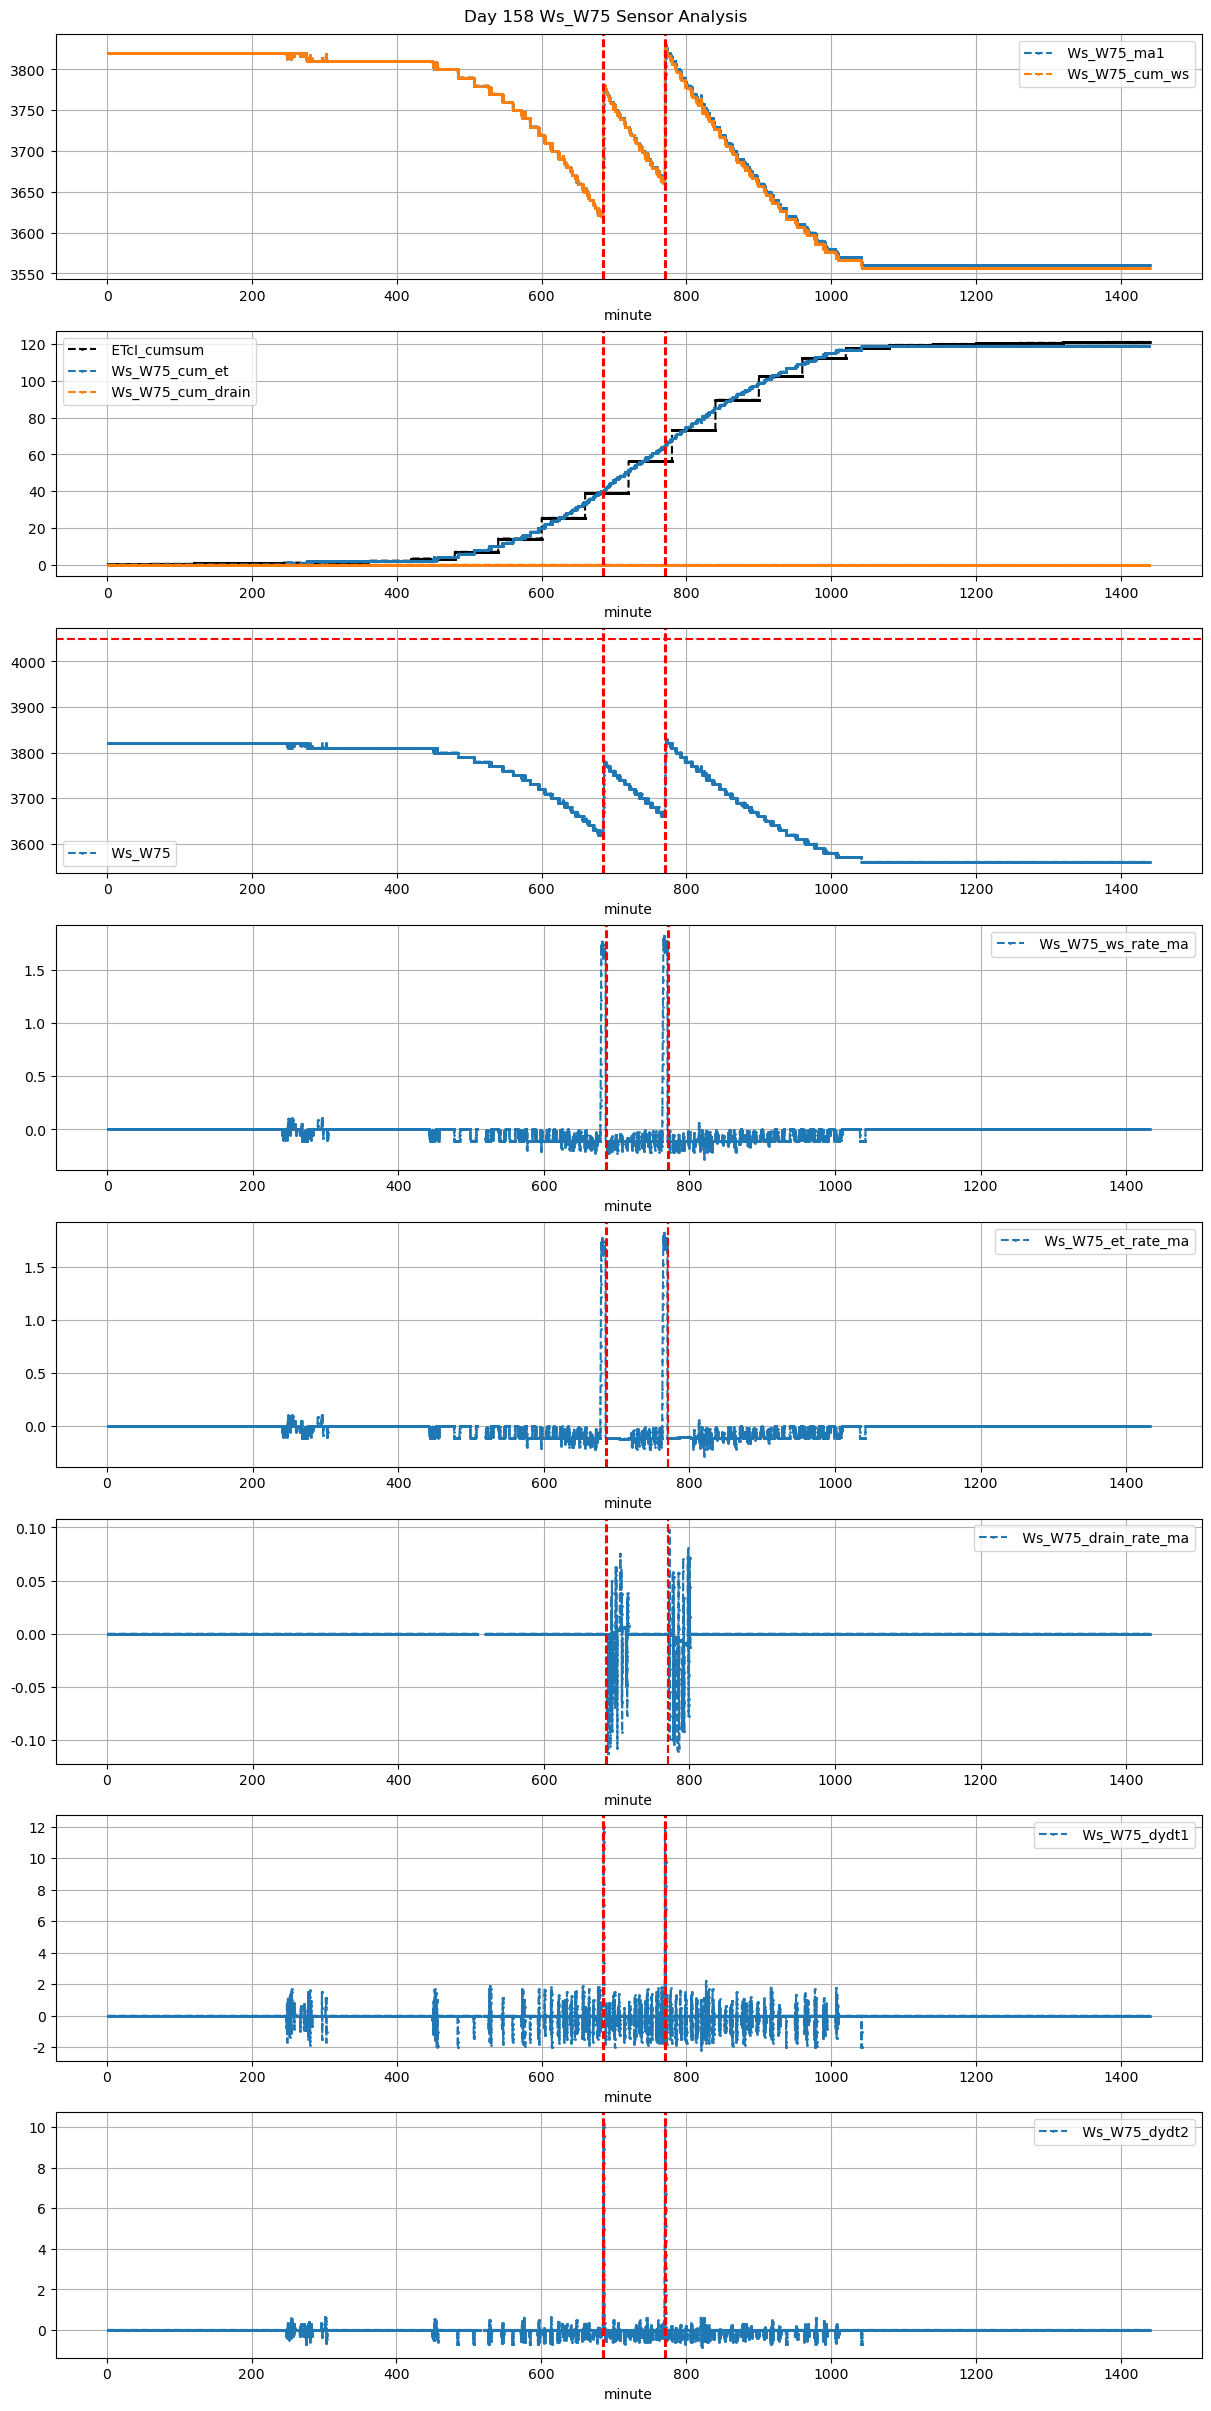
| ds | d | m | ws_name | prominence_cut | max_drain_du | fg_beg | fg_beg_est | fg_end | fg_end_est | ws_beg | ws_end | duc | pre_fg_et | post_fg_ws | post_drn_et | fg_rate_by_dydt | fg_rate_by_dWs | fg_stay_amount | enough_data | fg_beg_delta | fg_end_delta | fg_total_amount | fg_drain_amount | postFg_drain_amount | total_drain_amount | drain_du | drain_delay | drain_rate | field_capacity_est |
|---|---|---|---|---|---|---|---|---|---|---|---|---|---|---|---|---|---|---|---|---|---|---|---|---|---|---|---|---|---|
| 2026-03-13 11:25:01+08:00 | 158 | 685 | Ws_W75 | 0.902638 | 30 | 685.02 | 684.833333 | 686.22 | 686.333333 | 3620.0 | 3780.0 | 72 | -0.102637 | -0.168981 | -0.118254 | 0.381905 | 0.444444 | 32.0 | True | -11.2 | 6.8 | 32.0 | 0.0 | 0 | 0.0 | 10 | 116 | -1.384887 | NaN |
| 2026-03-13 12:50:01+08:00 | 158 | 770 | Ws_W75 | 0.902638 | 30 | 770.02 | 769.750000 | 771.22 | 771.333333 | 3661.0 | 3830.0 | 72 | -0.095568 | -0.114352 | -0.086667 | 0.371786 | 0.469444 | 33.8 | True | -16.2 | 6.8 | 33.8 | 0.0 | 0 | 0.0 | 25 | 101 | -1.412236 | NaN |