| 2026-03-12 08:00:00+08:00 |
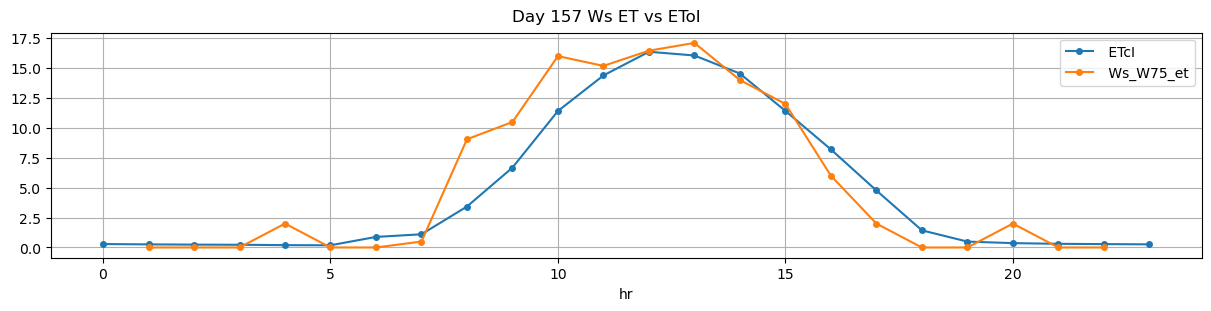
157 |
480 |
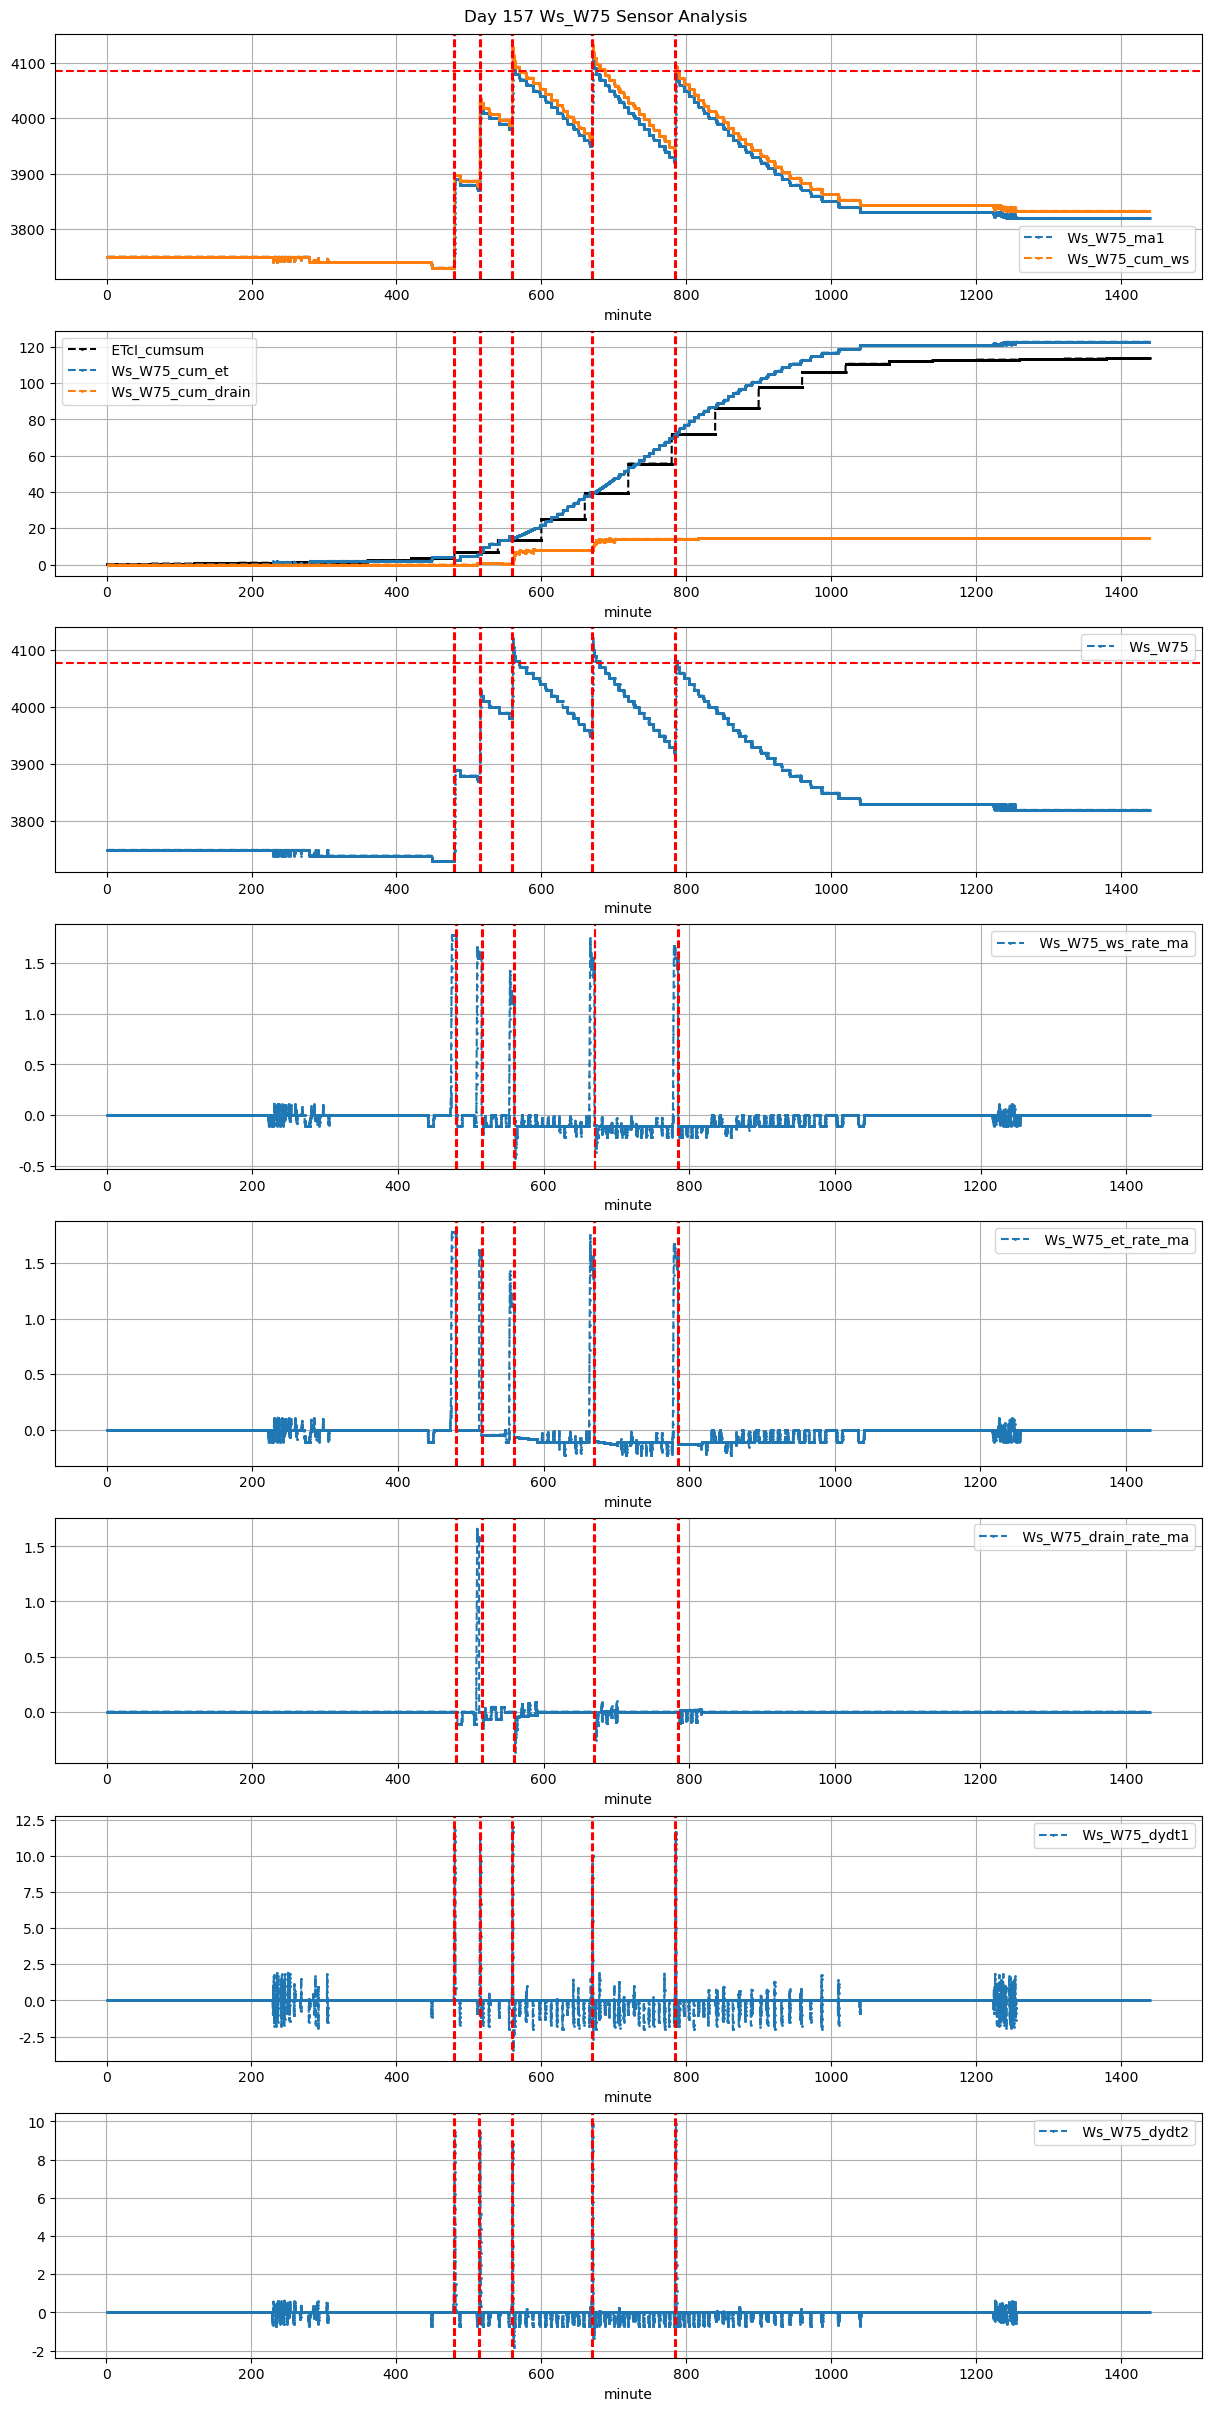
Ws_W75 |
1.249129 |
30 |
480.00 |
479.666667 |
481.18 |
481.583333 |
3730.0 |
3890.000000 |
71 |
0.000000 |
-0.088889 |
0.000000 |
0.339429 |
0.450704 |
32.000000 |
True |
-20.0 |
24.2 |
32.000000 |
0.000000 |
0.000000 |
0.000000 |
354 |
44 |
-0.111111 |
NaN |
| 2026-03-12 08:34:59+08:00 |
157 |
514 |
Ws_W75 |
1.249129 |
30 |
514.98 |
514.750000 |
516.26 |
516.500000 |
3870.0 |
4027.777778 |
77 |
-0.046380 |
-0.104801 |
-0.040123 |
0.350000 |
0.409812 |
31.555556 |
True |
-13.8 |
14.4 |
33.803000 |
0.000000 |
0.000000 |
0.000000 |
184 |
19 |
-0.069837 |
NaN |
| 2026-03-12 09:20:00+08:00 |
157 |
560 |
Ws_W75 |
1.249129 |
30 |
560.00 |
559.750000 |
561.20 |
561.250000 |
3980.0 |
4114.000000 |
72 |
-0.063920 |
-0.150412 |
-0.084568 |
0.329143 |
0.372222 |
26.800000 |
True |
-15.0 |
3.0 |
31.608000 |
3.249781 |
6.499562 |
9.749343 |
499 |
7 |
-0.152802 |
4081.502189 |
| 2026-03-12 11:10:00+08:00 |
157 |
670 |
Ws_W75 |
1.249129 |
30 |
670.00 |
669.750000 |
671.23 |
671.500000 |
3950.0 |
4112.666667 |
74 |
-0.100125 |
-0.177160 |
-0.130864 |
0.356762 |
0.439640 |
32.533333 |
True |
-15.0 |
16.2 |
32.533333 |
0.000000 |
4.907857 |
4.907857 |
465 |
21 |
-0.186677 |
4088.127384 |
| 2026-03-12 13:05:00+08:00 |
157 |
785 |
Ws_W75 |
1.249129 |
30 |
785.00 |
784.750000 |
786.17 |
786.500000 |
3930.0 |
4080.000000 |
70 |
-0.123533 |
-0.145679 |
-0.130988 |
0.360238 |
0.428571 |
30.000000 |
True |
-15.0 |
19.8 |
30.730000 |
0.000000 |
0.000000 |
0.000000 |
64 |
24 |
-0.098584 |
NaN |