| 2026-03-11 08:30:00+08:00 |
156 |
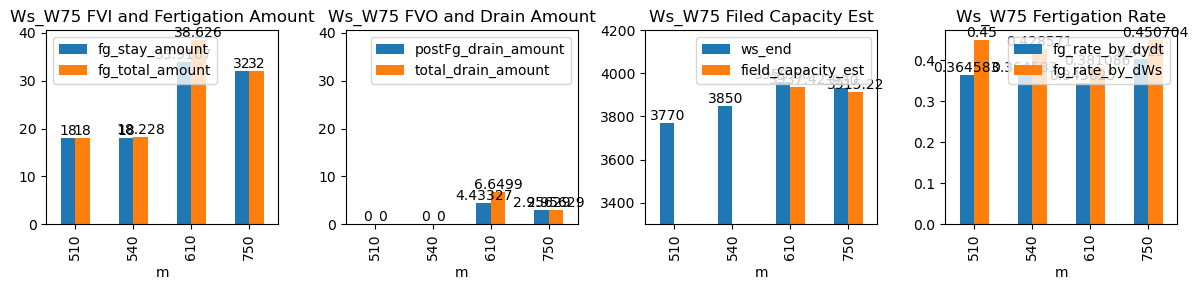
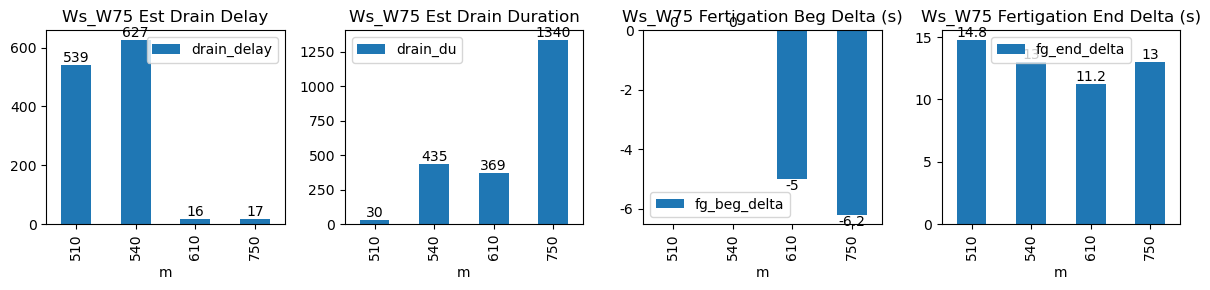
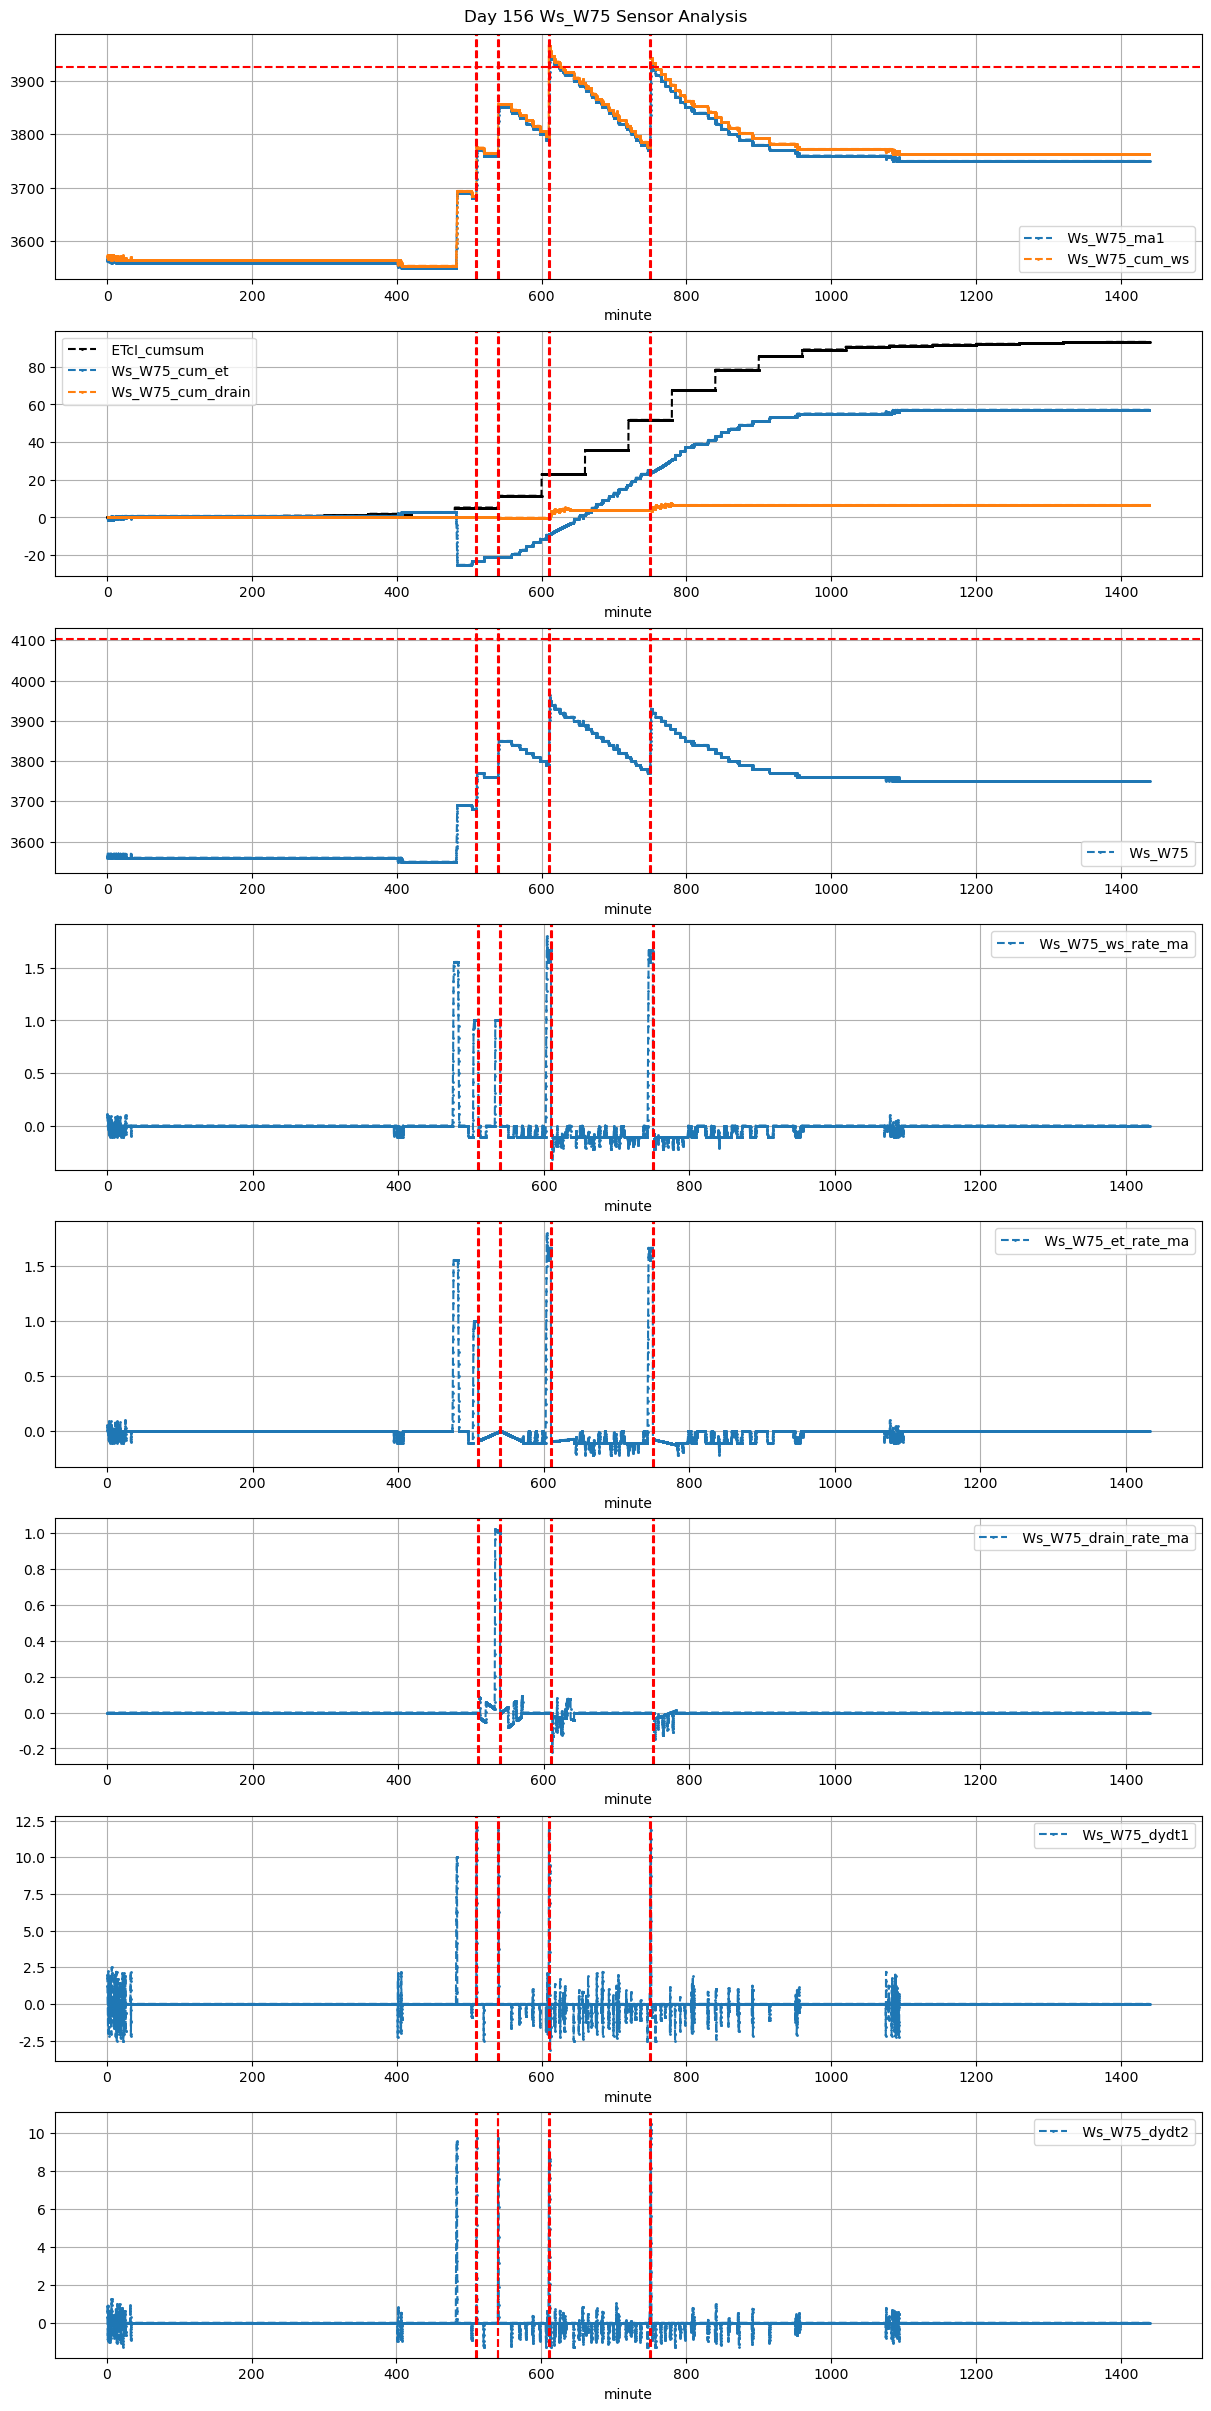
510 |
Ws_W75 |
1.658213 |
29.083333 |
510.00 |
510.000000 |
510.67 |
510.916667 |
3680.0 |
3770.000000 |
40 |
-0.096754 |
-0.084860 |
0.000000 |
0.364583 |
0.450000 |
18.000000 |
True |
0.0 |
14.8 |
18.000 |
0.000000 |
0.000000 |
0.000000 |
30 |
539 |
-0.051758 |
NaN |
| 2026-03-11 09:00:00+08:00 |
156 |
540 |
Ws_W75 |
1.658213 |
30.000000 |
540.00 |
540.000000 |
540.70 |
540.916667 |
3760.0 |
3850.000000 |
42 |
-0.043435 |
0.000000 |
-0.093107 |
0.364583 |
0.428571 |
18.000000 |
True |
0.0 |
13.0 |
18.228 |
0.000000 |
0.000000 |
0.000000 |
435 |
627 |
-0.076955 |
NaN |
| 2026-03-11 10:10:00+08:00 |
156 |
610 |
Ws_W75 |
1.658213 |
30.000000 |
610.00 |
609.916667 |
611.48 |
611.666667 |
3790.0 |
3959.583333 |
89 |
-0.093321 |
-0.137037 |
-0.070988 |
0.345625 |
0.381086 |
33.916667 |
True |
-5.0 |
11.2 |
38.626 |
2.216633 |
4.433266 |
6.649899 |
369 |
16 |
-0.115821 |
3937.417005 |
| 2026-03-11 12:30:01+08:00 |
156 |
750 |
Ws_W75 |
1.658213 |
30.000000 |
750.02 |
749.916667 |
751.20 |
751.416667 |
3770.0 |
3930.000000 |
71 |
-0.076217 |
-0.133951 |
-0.122840 |
0.402500 |
0.450704 |
32.000000 |
True |
-6.2 |
13.0 |
32.000 |
0.000000 |
2.956289 |
2.956289 |
1340 |
17 |
-0.126629 |
3915.218557 |