| 2026-03-22 08:20:00+08:00 |
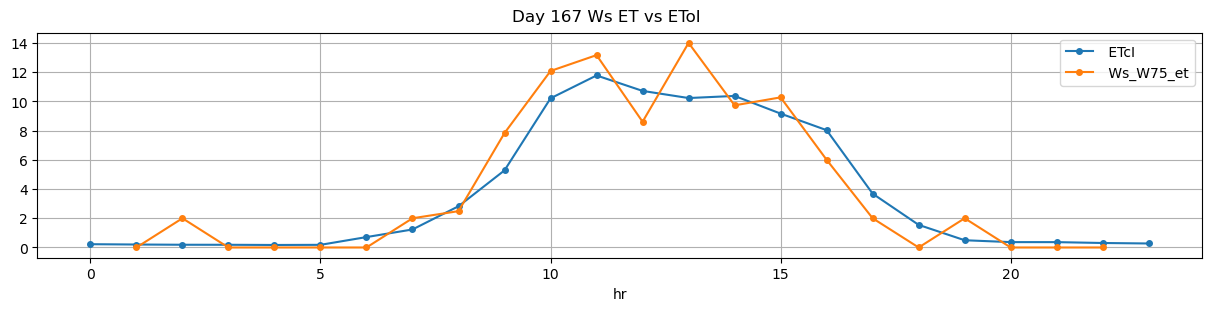
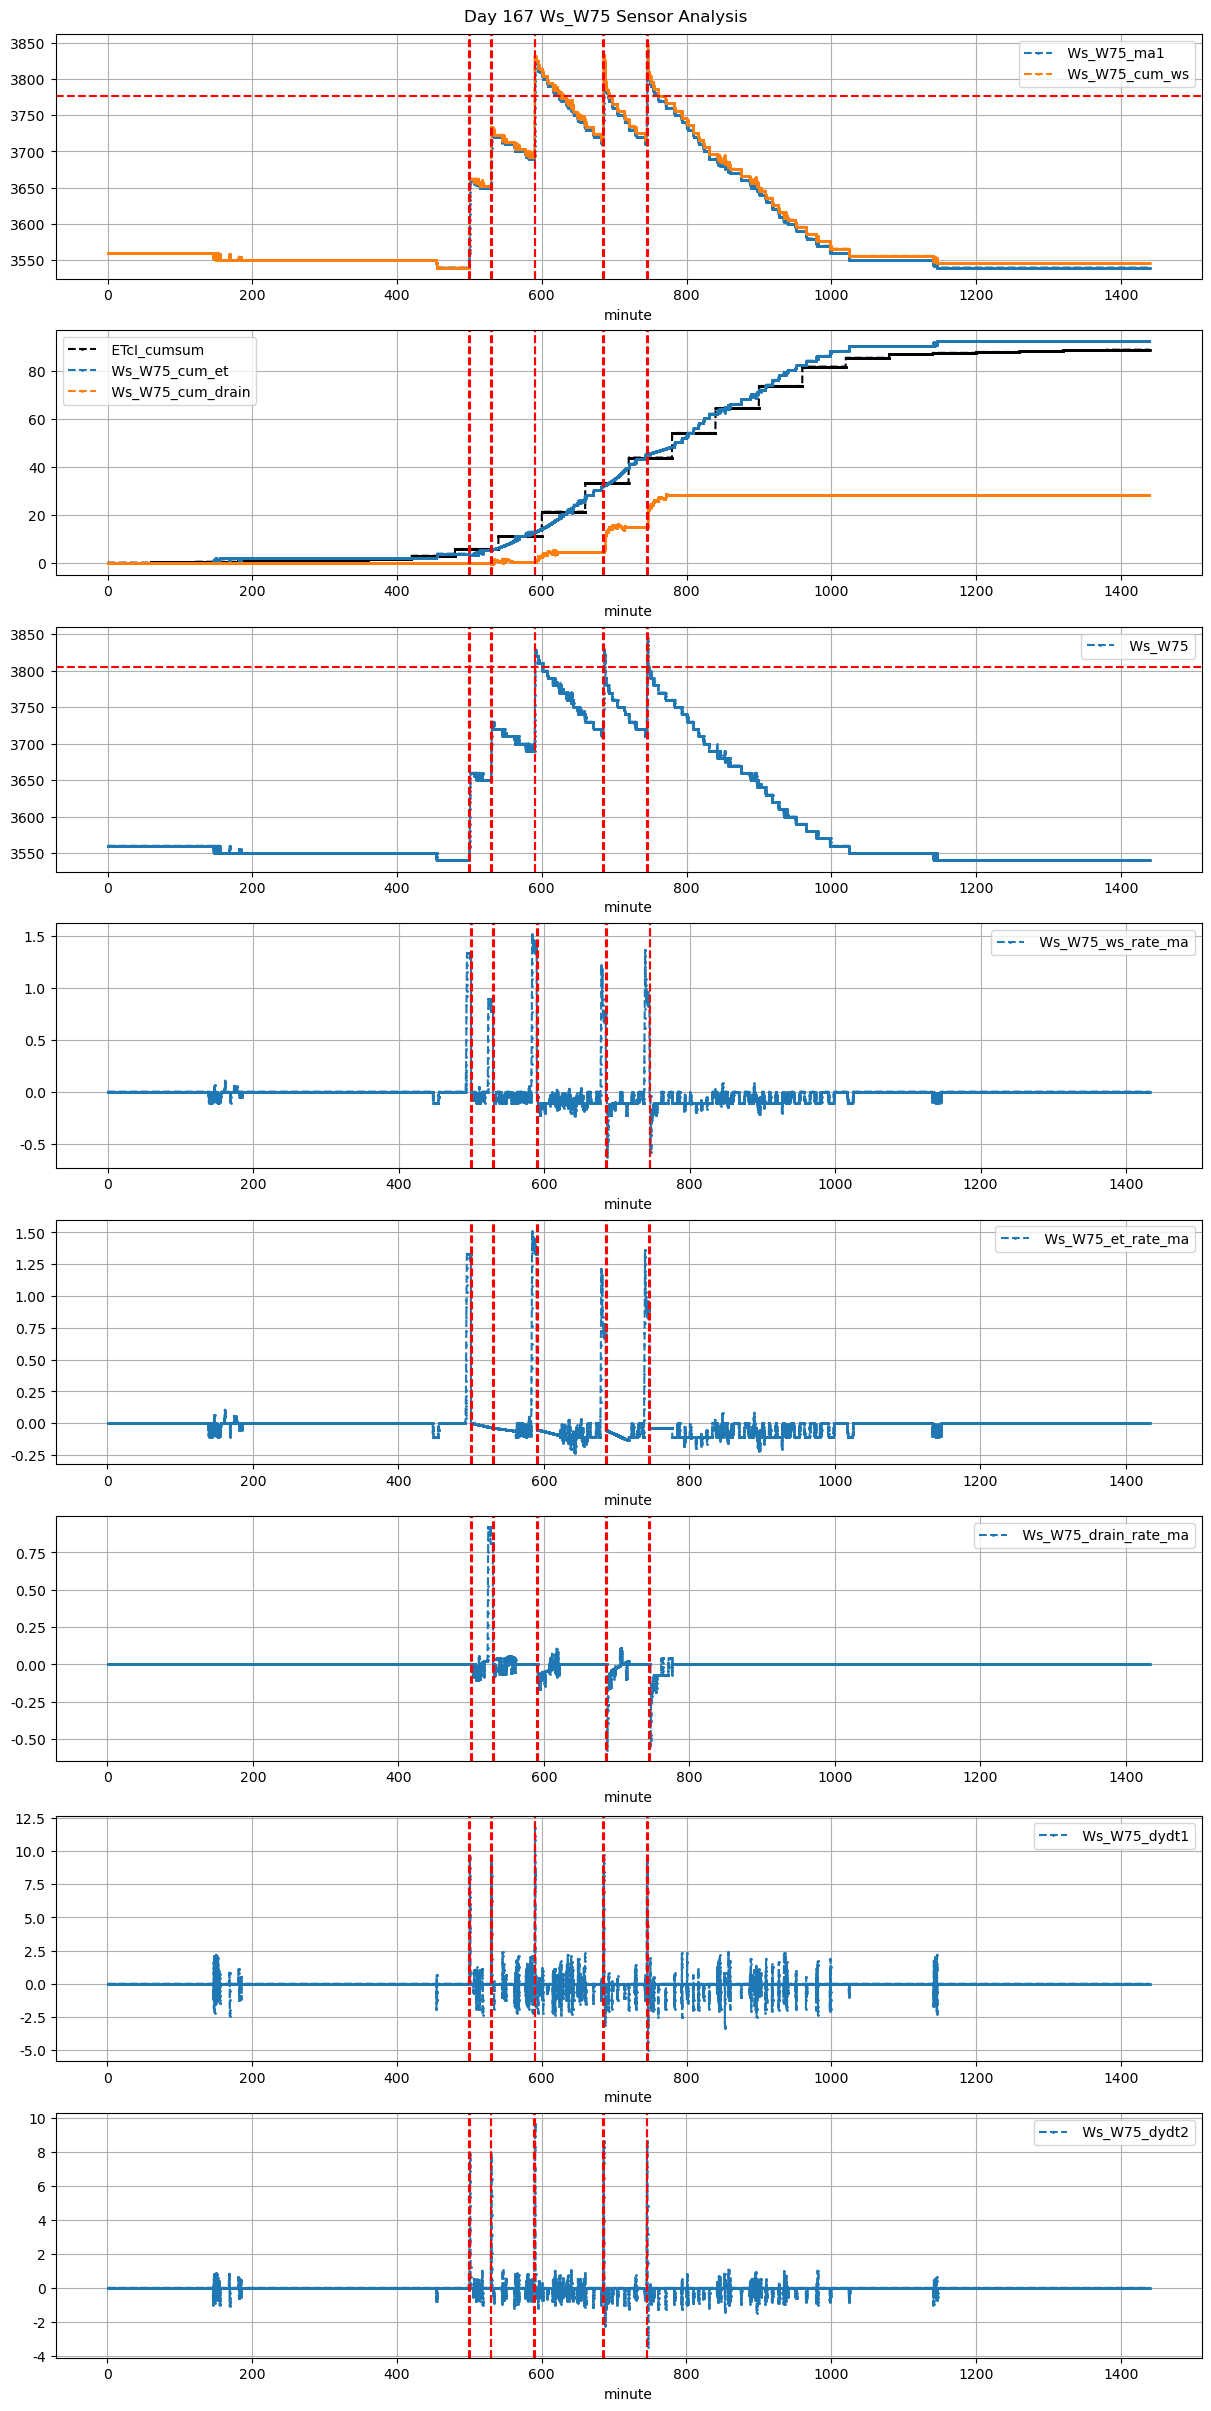
167 |
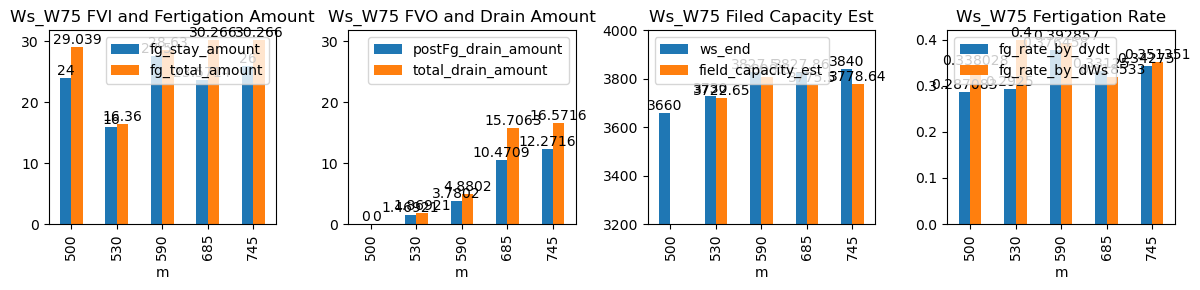
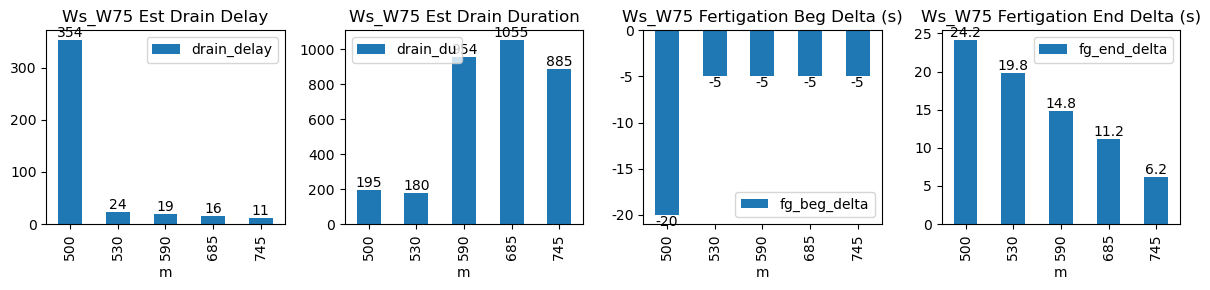
500 |
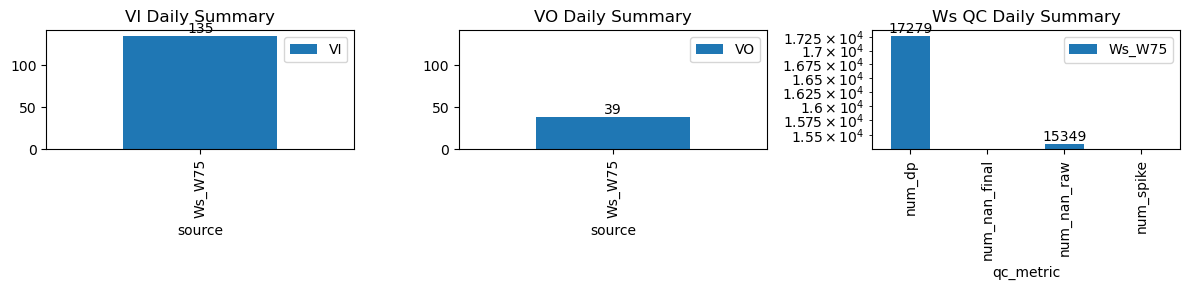
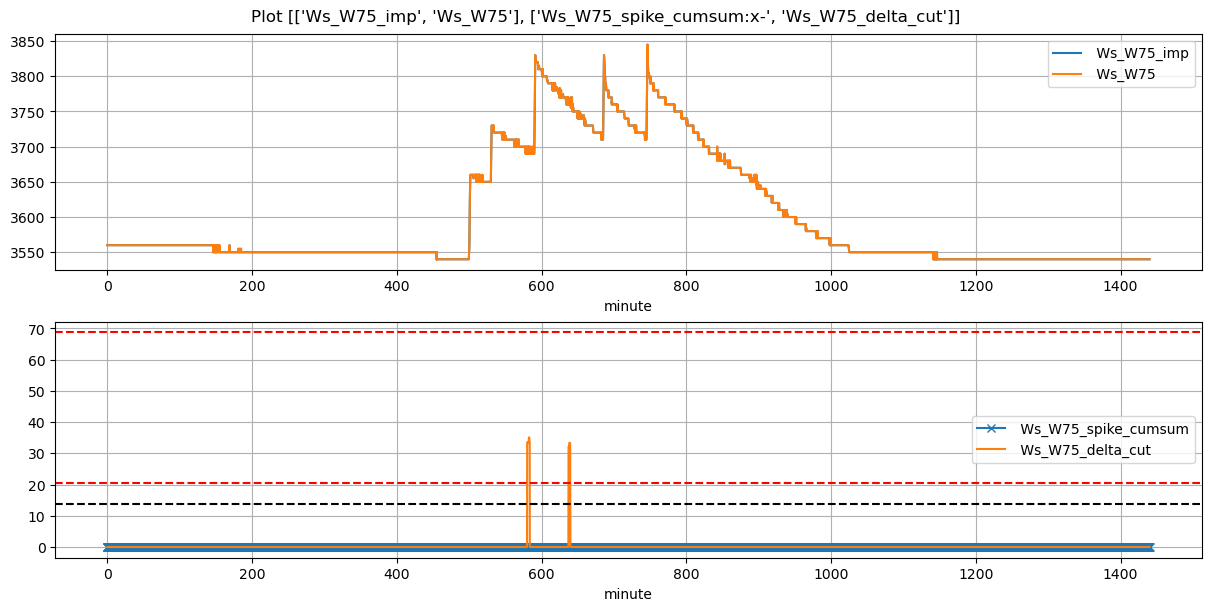
Ws_W75 |
0.959129 |
28.416667 |
500.0 |
499.666667 |
501.18 |
501.583333 |
3540.0 |
3660.000000 |
71 |
0.000000 |
-0.053395 |
0.000000 |
0.287083 |
0.338028 |
24.000000 |
True |
-20.0 |
24.2 |
29.039 |
0.000000 |
0.000000 |
0.000000 |
195 |
354 |
-0.103261 |
NaN |
| 2026-03-22 08:50:00+08:00 |
167 |
530 |
Ws_W75 |
0.959129 |
30.000000 |
530.0 |
529.916667 |
530.67 |
531.000000 |
3650.0 |
3730.000000 |
40 |
-0.036662 |
-0.048148 |
-0.060905 |
0.292500 |
0.400000 |
16.000000 |
True |
-5.0 |
19.8 |
16.360 |
0.400000 |
1.469208 |
1.869208 |
180 |
24 |
-0.073777 |
3722.653958 |
| 2026-03-22 09:50:00+08:00 |
167 |
590 |
Ws_W75 |
0.959129 |
30.000000 |
590.0 |
589.916667 |
591.17 |
591.416667 |
3690.0 |
3827.500000 |
70 |
-0.050874 |
-0.145576 |
-0.093621 |
0.376458 |
0.392857 |
27.500000 |
True |
-5.0 |
14.8 |
28.630 |
1.100000 |
3.780202 |
4.880202 |
954 |
19 |
-0.124516 |
3808.598989 |
| 2026-03-22 11:25:00+08:00 |
167 |
685 |
Ws_W75 |
0.959129 |
30.000000 |
685.0 |
684.916667 |
686.23 |
686.416667 |
3710.0 |
3827.857143 |
74 |
-0.056804 |
-0.246076 |
-0.135802 |
0.331250 |
0.318533 |
23.571429 |
True |
-5.0 |
11.2 |
30.266 |
5.235431 |
10.470862 |
15.706293 |
1055 |
16 |
-0.318179 |
3775.502832 |
| 2026-03-22 12:25:00+08:00 |
167 |
745 |
Ws_W75 |
0.959129 |
30.000000 |
745.0 |
744.916667 |
746.23 |
746.333333 |
3710.0 |
3840.000000 |
74 |
-0.038468 |
-0.198971 |
-0.041358 |
0.342750 |
0.351351 |
26.000000 |
True |
-5.0 |
6.2 |
30.266 |
4.300000 |
12.271569 |
16.571569 |
885 |
11 |
-0.211419 |
3778.642157 |