| 2026-03-23 07:51:16+08:00 |
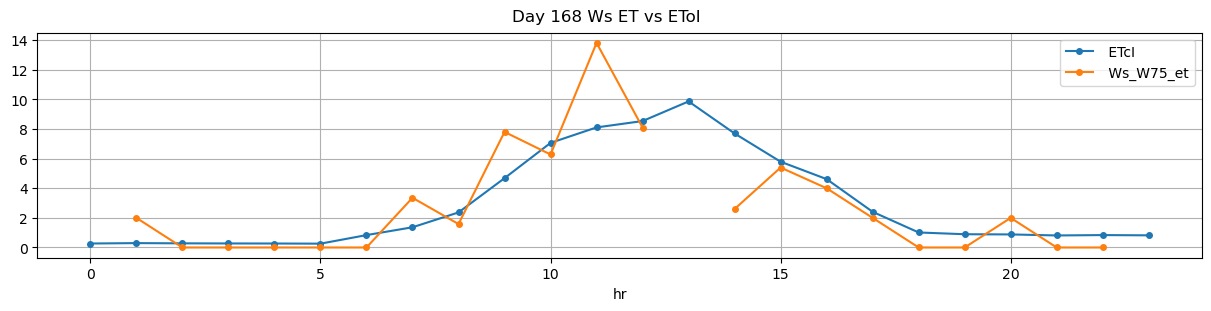
168 |
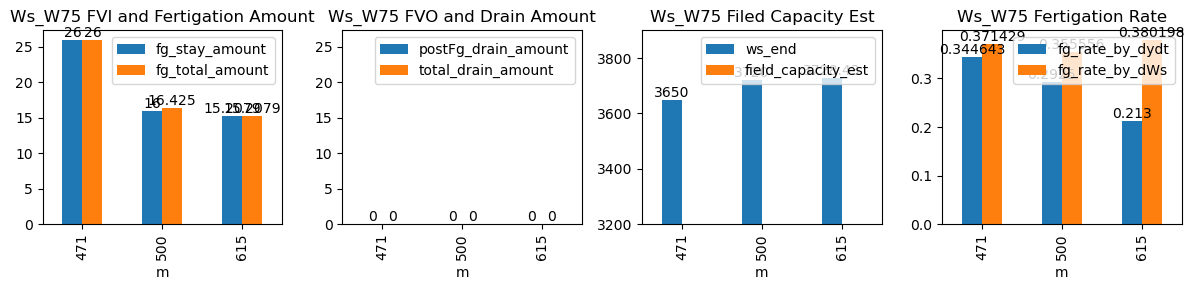
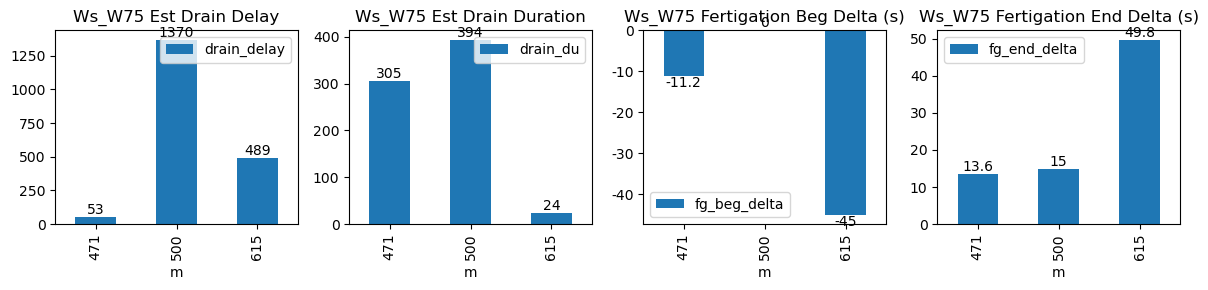
471 |
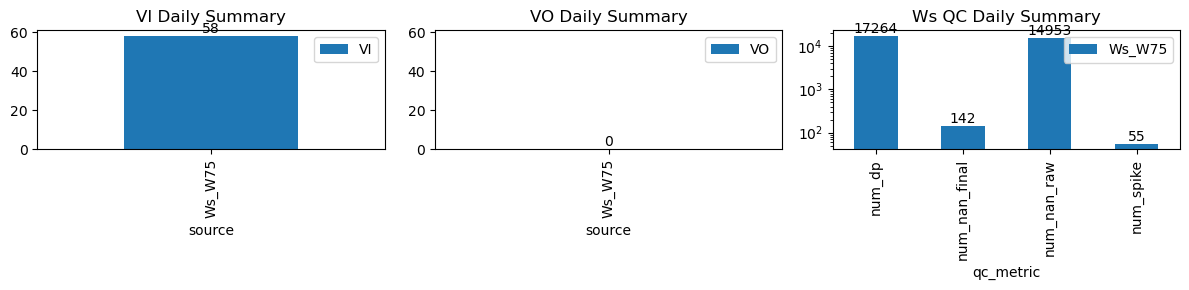
Ws_W75 |
1.417613 |
27.333333 |
471.27 |
471.083333 |
472.44 |
472.666667 |
3520.000000 |
3650.000000 |
70 |
0.000000 |
-0.082716 |
0.000000 |
0.344643 |
0.371429 |
26.000000 |
True |
-11.2 |
13.6 |
26.000000 |
0.0 |
0 |
0.0 |
305 |
53 |
-0.111111 |
NaN |
| 2026-03-23 08:20:00+08:00 |
168 |
500 |
Ws_W75 |
1.417613 |
30.000000 |
500.00 |
500.000000 |
500.75 |
501.000000 |
3640.000000 |
3720.000000 |
45 |
-0.016449 |
0.000000 |
-0.104835 |
0.292500 |
0.355556 |
16.000000 |
True |
0.0 |
15.0 |
16.425000 |
0.0 |
0 |
0.0 |
394 |
1370 |
-0.030776 |
NaN |
| 2026-03-23 10:15:00+08:00 |
168 |
615 |
Ws_W75 |
1.417613 |
30.000000 |
615.00 |
614.250000 |
615.67 |
616.500000 |
3652.388889 |
3728.428571 |
40 |
-0.113280 |
-0.017688 |
-0.100947 |
0.213000 |
0.380198 |
15.207937 |
True |
-45.0 |
49.8 |
15.207937 |
0.0 |
0 |
0.0 |
24 |
489 |
-0.225792 |
NaN |