VI and VO Daily Summary
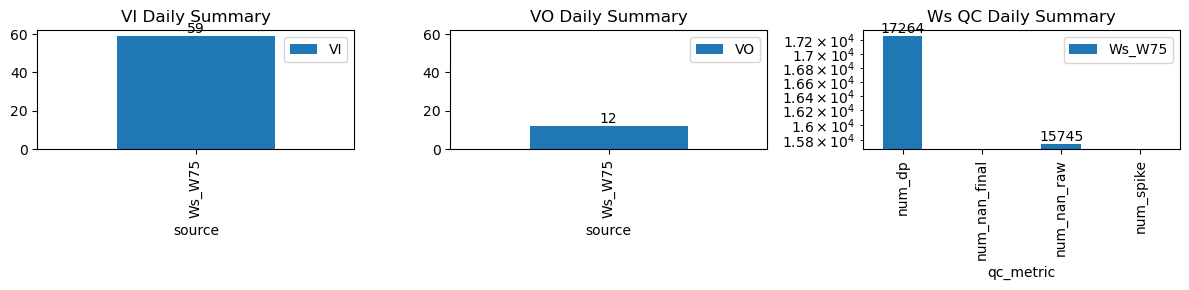
| ws_name | num_dp | num_nan_raw | num_nan_final | num_spike | cum_step_adj |
|---|---|---|---|---|---|
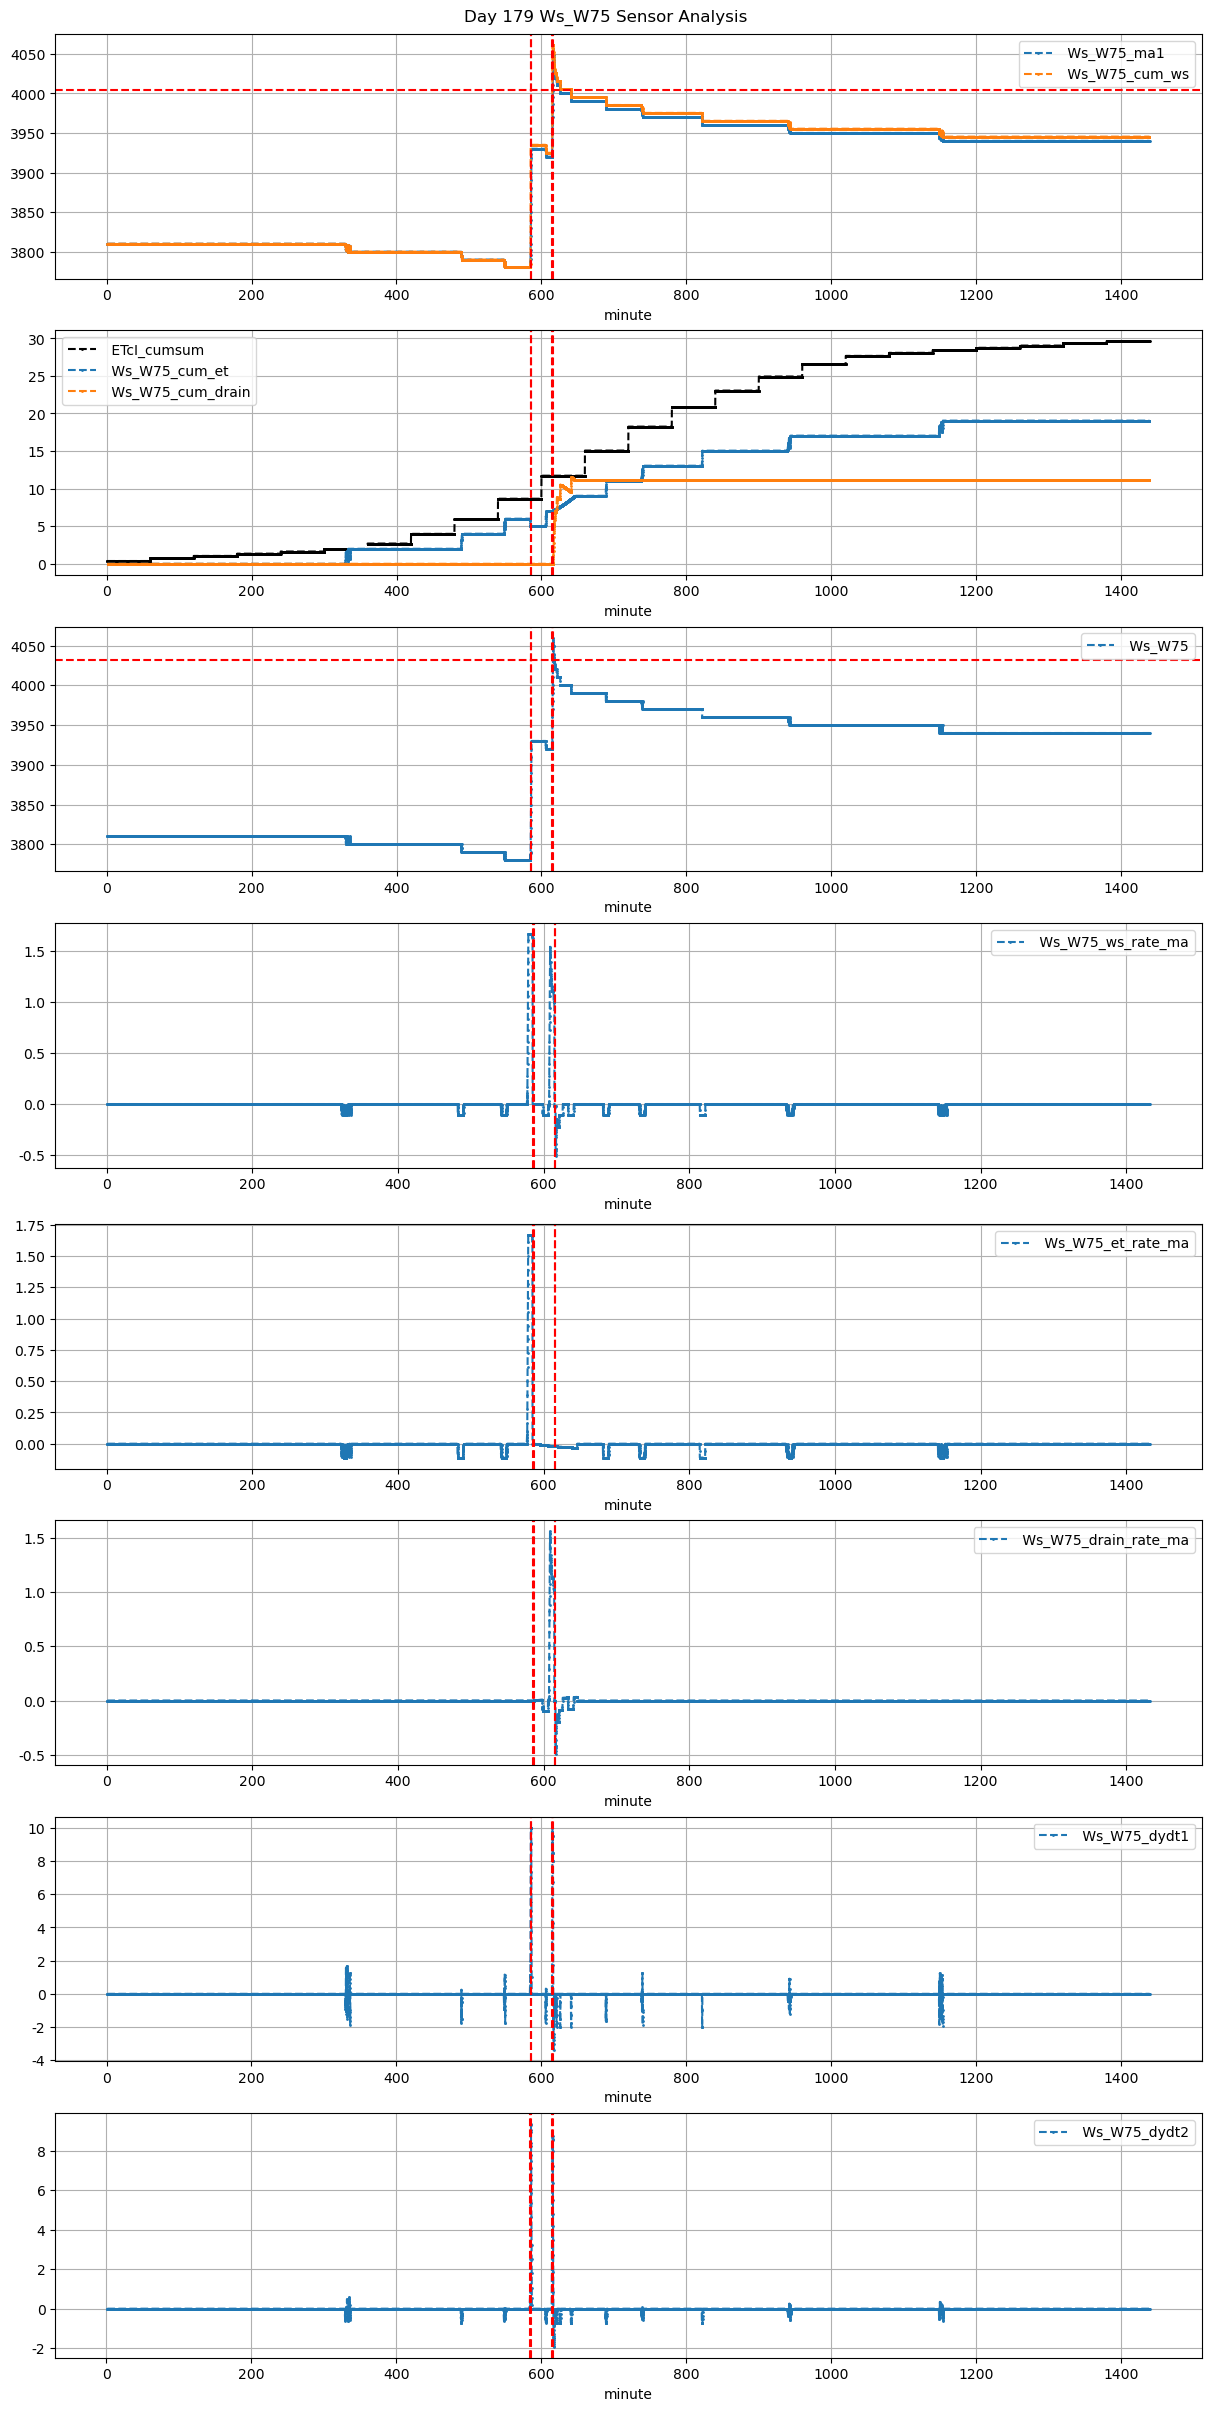
| Ws_W75 | 17,264 | 15,745 | 0 | 0 | 0.00 |
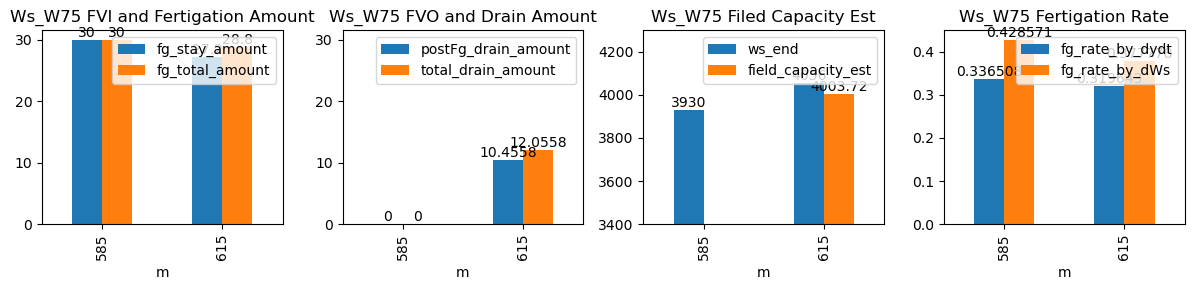
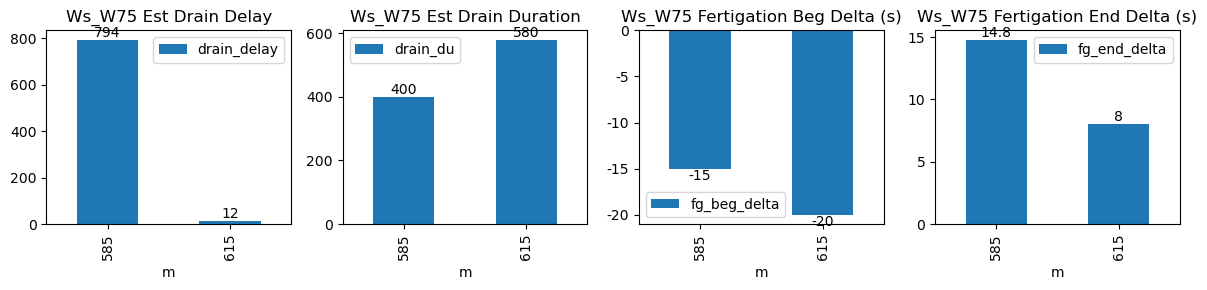
| ds | d | m | ws_name | prominence_cut | max_drain_du | fg_beg | fg_beg_est | fg_end | fg_end_est | ws_beg | ws_end | duc | pre_fg_et | post_fg_ws | post_drn_et | fg_rate_by_dydt | fg_rate_by_dWs | fg_stay_amount | enough_data | fg_beg_delta | fg_end_delta | fg_total_amount | fg_drain_amount | postFg_drain_amount | total_drain_amount | drain_du | drain_delay | drain_rate | field_capacity_est |
|---|---|---|---|---|---|---|---|---|---|---|---|---|---|---|---|---|---|---|---|---|---|---|---|---|---|---|---|---|---|
| 2026-04-03 09:45:00+08:00 | 179 | 585 | Ws_W75 | 1.124549 | 28.75 | 585.0 | 584.750000 | 586.17 | 586.25 | 3780.0 | 3930.0 | 70 | 0.00000 | 0.000000 | 0.0 | 0.344762 | 0.428571 | 30.0 | True | -15.0 | 4.8 | 30.0 | 0.0 | 0 | 0.0 | 19 | 1179 | -1.542974 | NaN |
| 2026-04-03 10:15:00+08:00 | 179 | 615 | Ws_W75 | 1.124549 | 30.00 | 615.0 | 614.666667 | 616.20 | 616.25 | 3920.0 | 4060.0 | 72 | -0.04661 | -0.299306 | 0.0 | 0.320714 | 0.388889 | 28.0 | True | -20.0 | 3.0 | 28.8 | 0.0 | 0 | 0.0 | 40 | 42 | -2.634454 | NaN |