| 2026-04-04 07:44:26+08:00 |
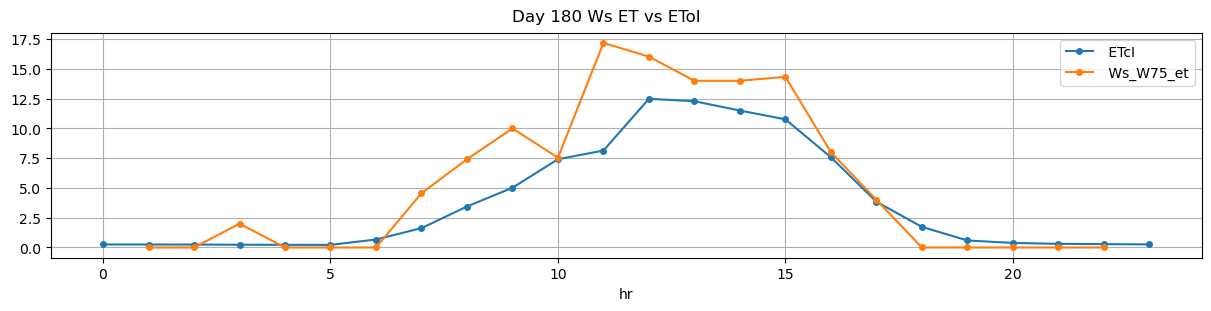
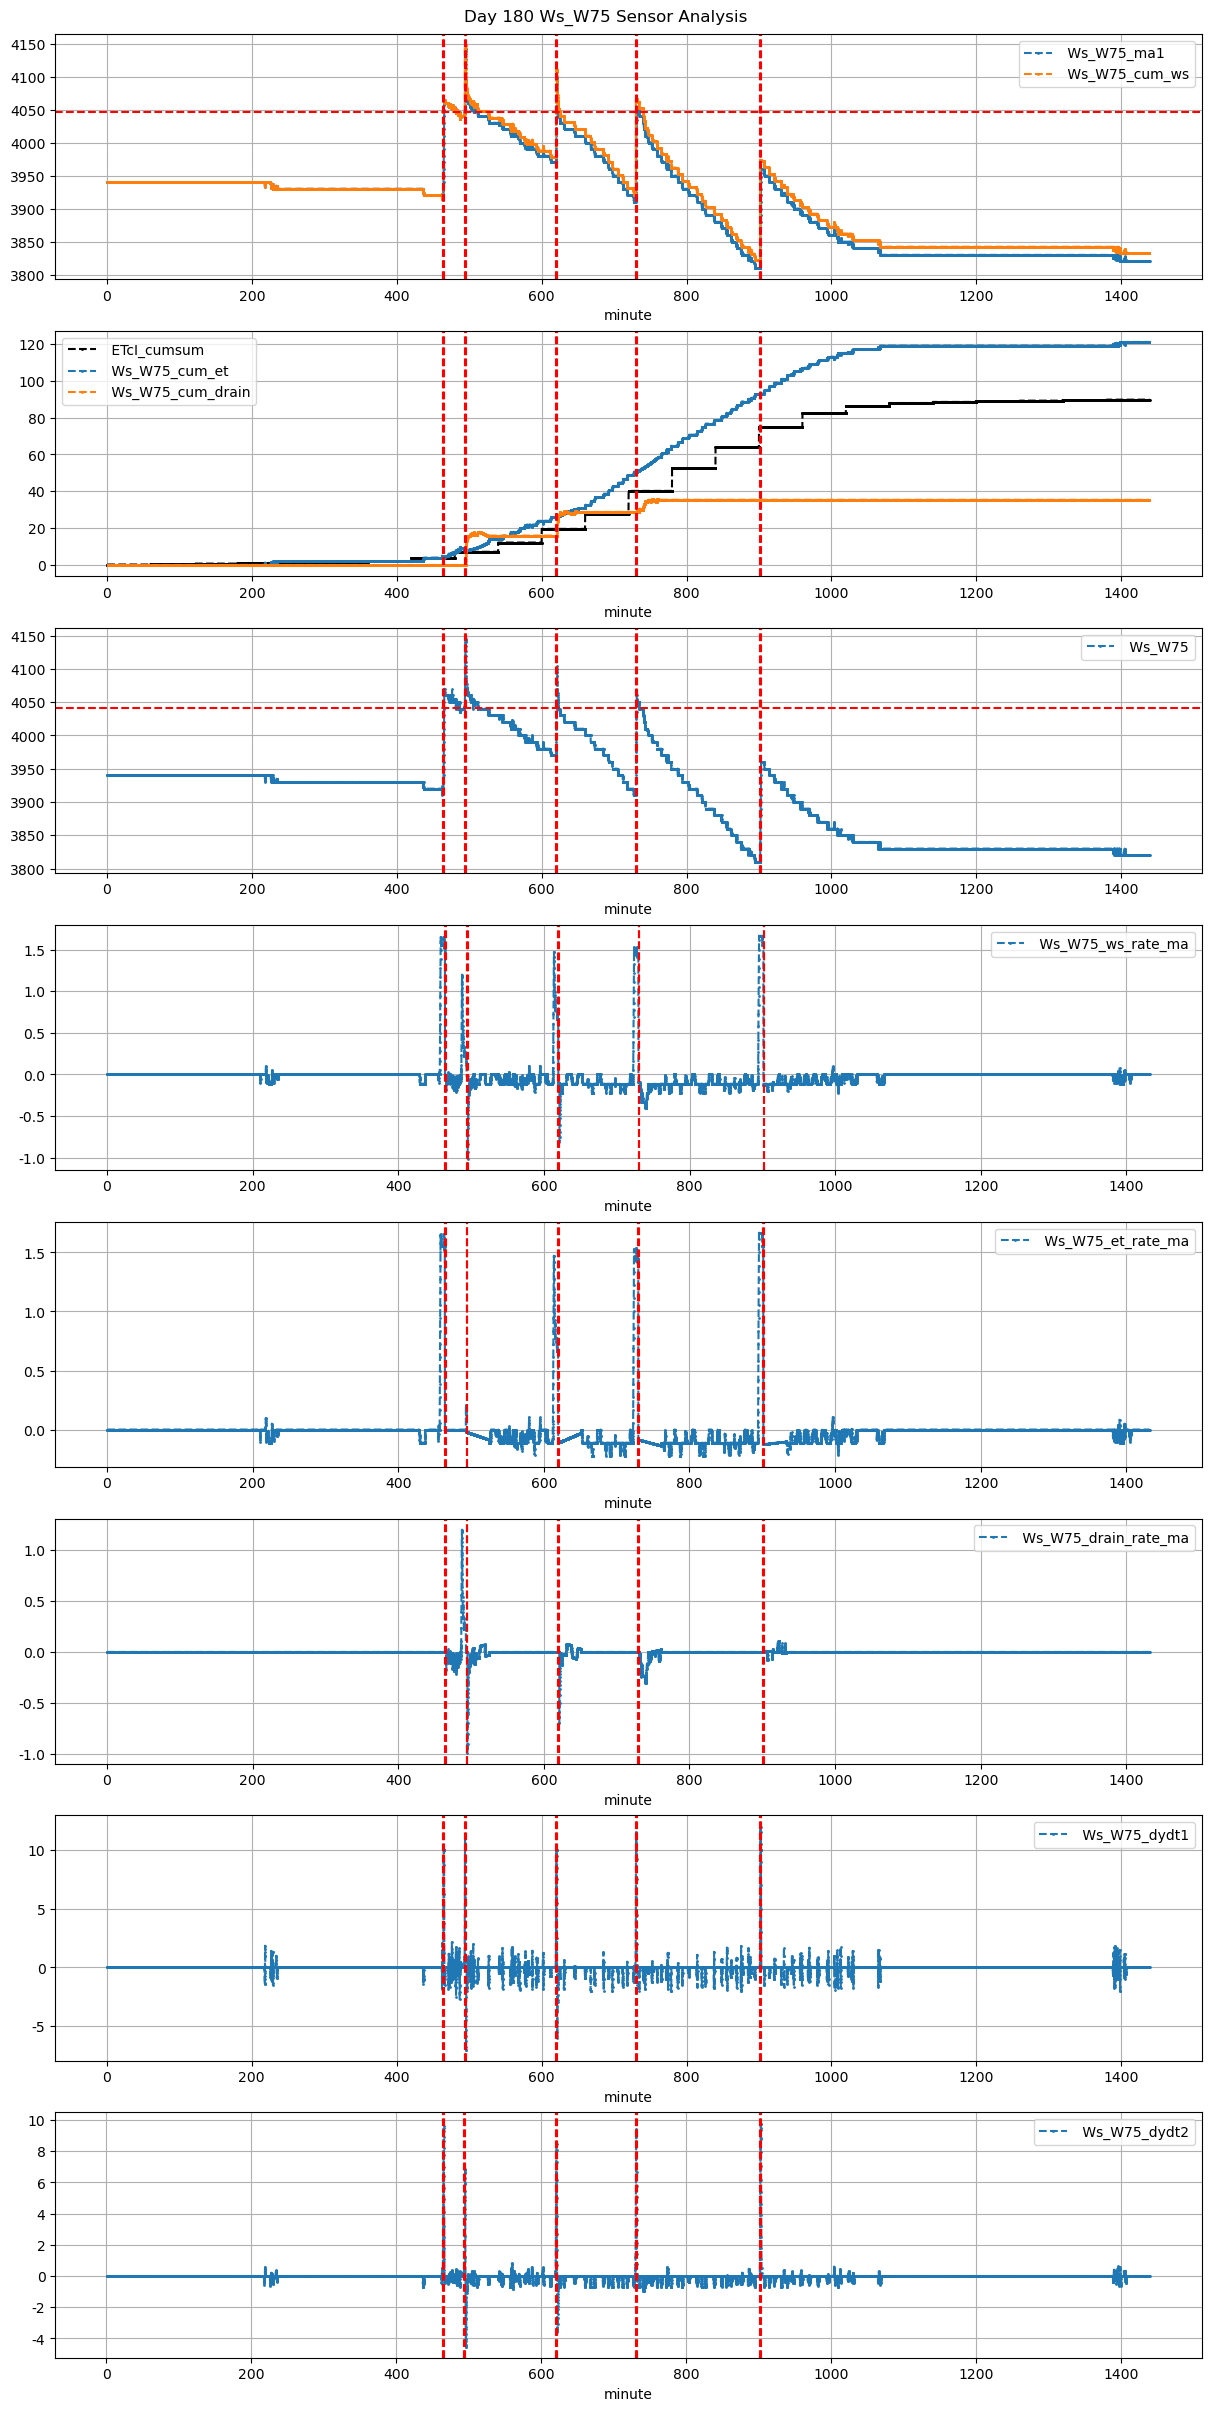
180 |
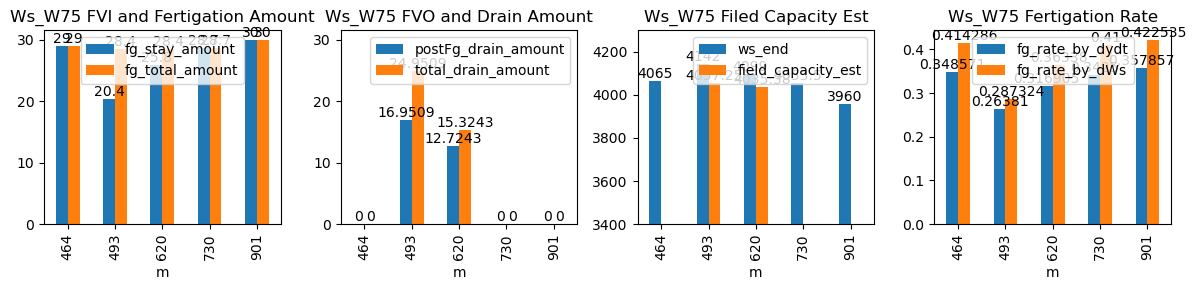
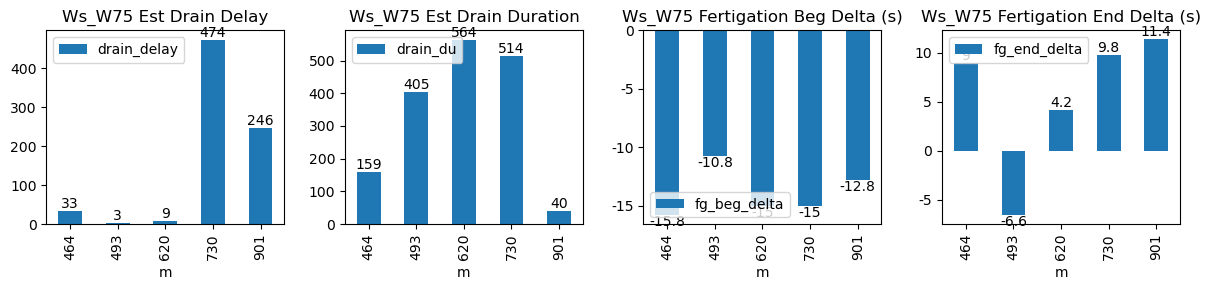
464 |
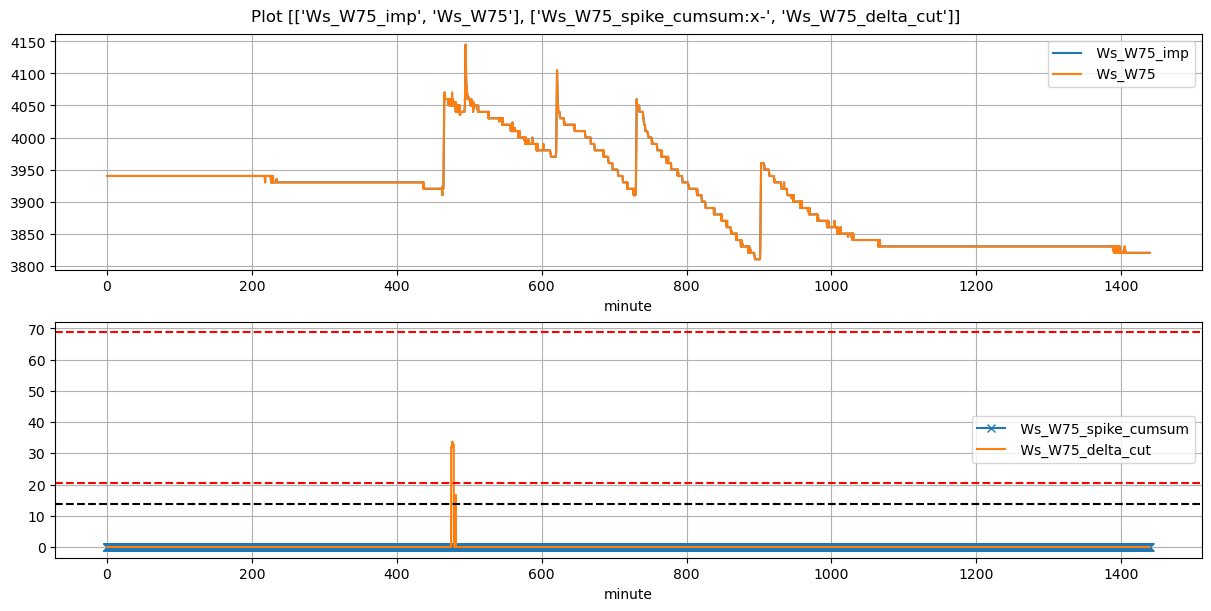
Ws_W75 |
1.818896 |
27.333333 |
464.43 |
464.166667 |
465.60 |
465.666667 |
3920.0 |
4070.0 |
70 |
-0.005179 |
-0.074583 |
0.000000 |
0.350714 |
0.428571 |
30.0 |
True |
-15.8 |
4.0 |
30.0 |
0.0 |
0.000000 |
0.000000 |
9 |
348 |
-1.685148 |
NaN |
| 2026-04-04 08:13:56+08:00 |
180 |
493 |
Ws_W75 |
1.818896 |
30.000000 |
493.93 |
493.750000 |
495.11 |
495.083333 |
4040.0 |
4145.0 |
71 |
-0.024890 |
-0.323958 |
-0.111111 |
0.261571 |
0.295775 |
21.0 |
True |
-10.8 |
-1.6 |
28.4 |
7.4 |
15.011999 |
22.411999 |
90 |
8 |
-5.407006 |
4069.940003 |
| 2026-04-04 10:20:00+08:00 |
180 |
620 |
Ws_W75 |
1.818896 |
30.000000 |
620.00 |
619.750000 |
621.18 |
621.250000 |
3970.0 |
4105.0 |
71 |
-0.080979 |
-0.291493 |
-0.001447 |
0.316905 |
0.380282 |
27.0 |
True |
-15.0 |
4.2 |
28.4 |
1.4 |
14.748858 |
16.148858 |
110 |
14 |
-4.620261 |
4031.255709 |
| 2026-04-04 12:10:00+08:00 |
180 |
730 |
Ws_W75 |
1.818896 |
30.000000 |
730.00 |
729.750000 |
731.17 |
731.250000 |
3910.0 |
4060.0 |
70 |
-0.091525 |
-0.169097 |
-0.138889 |
0.345714 |
0.428571 |
30.0 |
True |
-15.0 |
4.8 |
30.0 |
0.0 |
0.000000 |
0.000000 |
9 |
19 |
-1.355064 |
NaN |
| 2026-04-04 15:01:38+08:00 |
180 |
901 |
Ws_W75 |
1.818896 |
30.000000 |
901.63 |
901.416667 |
902.81 |
902.833333 |
3810.0 |
3960.0 |
71 |
-0.084040 |
-0.149537 |
-0.093056 |
0.366429 |
0.422535 |
30.0 |
True |
-12.8 |
1.4 |
30.0 |
0.0 |
0.000000 |
0.000000 |
24 |
271 |
-1.334649 |
NaN |