| 2026-04-08 07:25:00+08:00 |
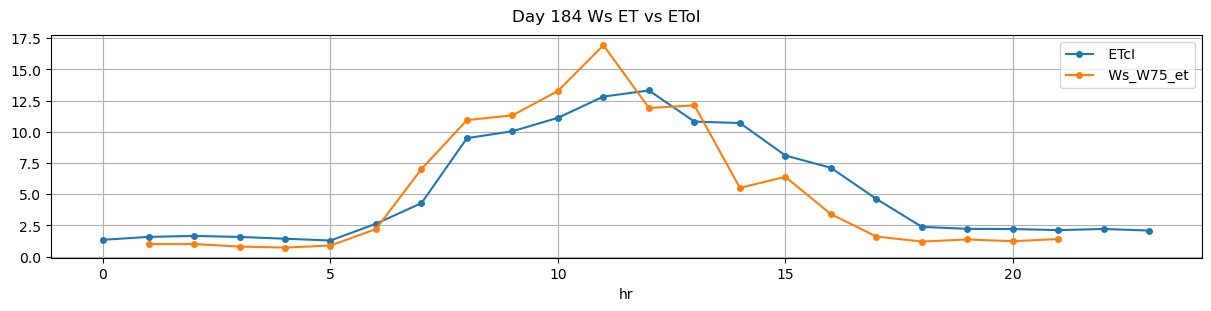
184 |
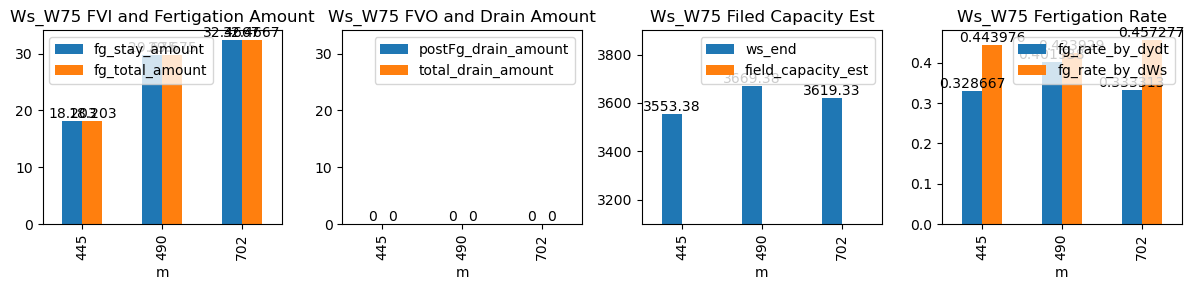
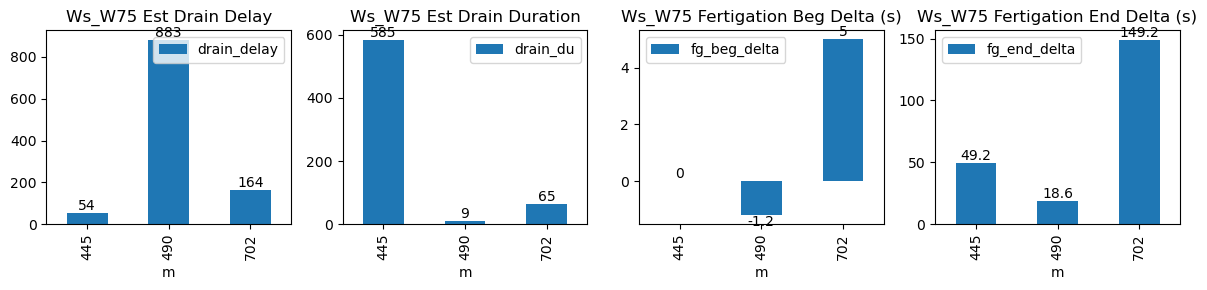
445 |
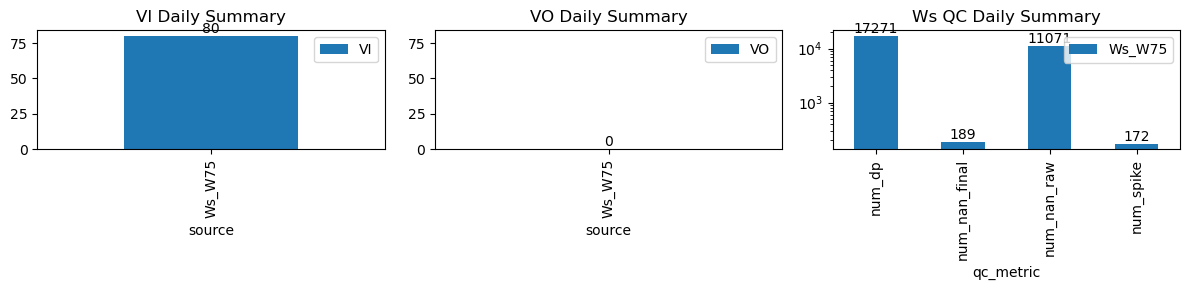
Ws_W75 |
1.060416 |
30 |
445.00 |
445.000000 |
445.68 |
446.500000 |
3462.36 |
3553.375000 |
41 |
-0.039888 |
-0.060082 |
-0.070303 |
0.328667 |
0.443976 |
18.203000 |
True |
0.0 |
49.2 |
18.203000 |
0.0 |
0 |
0.0 |
585 |
54 |
-0.021517 |
NaN |
| 2026-04-08 08:10:01+08:00 |
184 |
490 |
Ws_W75 |
1.060416 |
30 |
490.02 |
490.000000 |
491.19 |
491.500000 |
3521.00 |
3669.375000 |
70 |
-0.069174 |
-0.049595 |
-0.081127 |
0.401938 |
0.423929 |
29.675000 |
True |
-1.2 |
18.6 |
29.675000 |
0.0 |
0 |
0.0 |
9 |
883 |
-0.108713 |
NaN |
| 2026-04-08 11:42:15+08:00 |
184 |
702 |
Ws_W75 |
1.060416 |
30 |
702.25 |
702.333333 |
703.43 |
705.916667 |
3457.00 |
3619.333333 |
71 |
-0.078964 |
-0.136019 |
-0.087305 |
0.333313 |
0.457277 |
32.466667 |
True |
5.0 |
149.2 |
32.466667 |
0.0 |
0 |
0.0 |
65 |
164 |
-0.152597 |
NaN |