| 2026-04-07 07:25:00+08:00 |
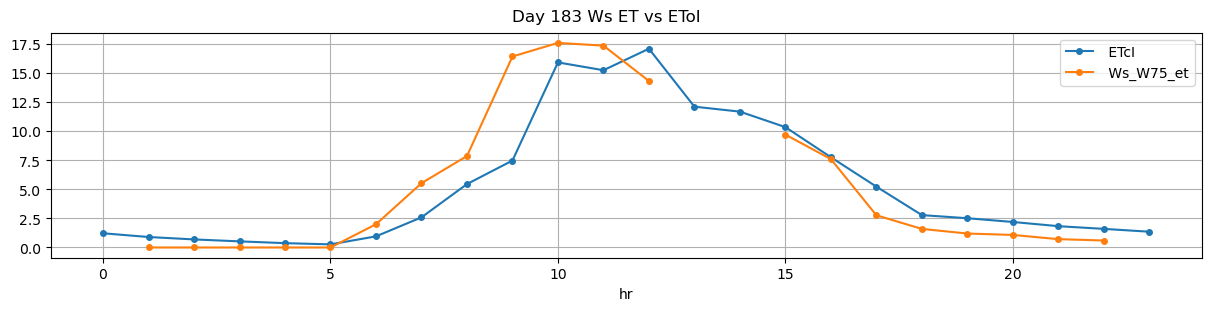
183 |
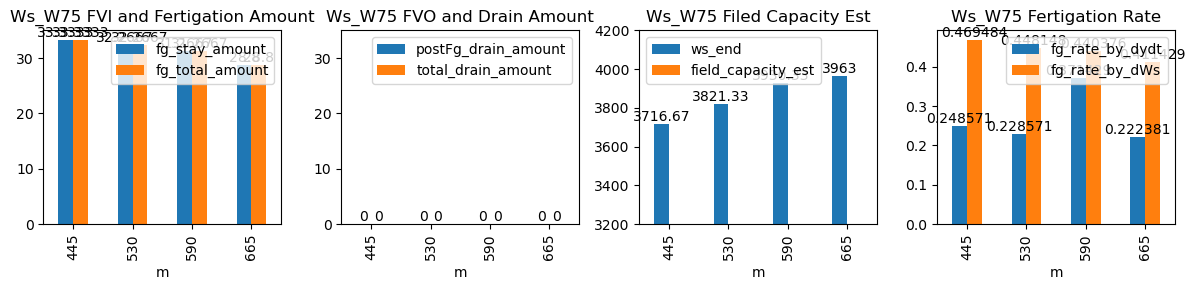
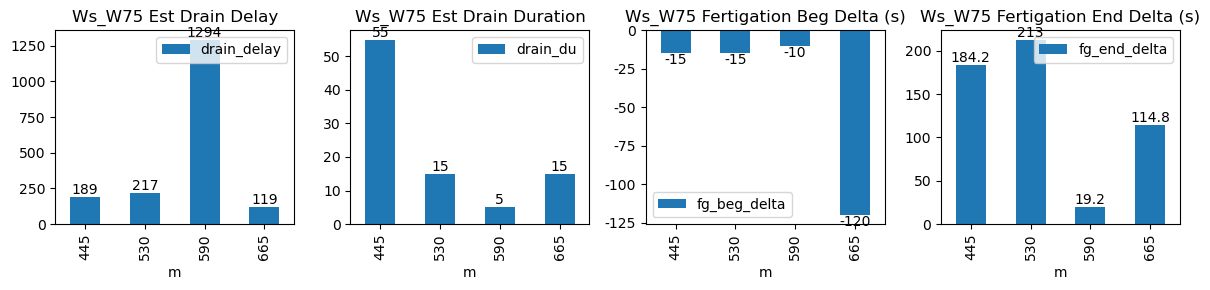
445 |
Ws_W75 |
1.053488 |
30 |
445.0 |
444.750000 |
446.18 |
449.250000 |
3550.0 |
3716.666667 |
71 |
-5.109521e-15 |
-0.066461 |
-0.050309 |
0.248571 |
0.469484 |
33.333333 |
True |
-15.0 |
184.2 |
33.333333 |
0.0 |
0 |
0.0 |
55 |
189 |
-0.101561 |
NaN |
| 2026-04-07 08:50:00+08:00 |
183 |
530 |
Ws_W75 |
1.053488 |
30 |
530.0 |
529.750000 |
531.20 |
534.750000 |
3660.0 |
3821.333333 |
72 |
-6.868090e-02 |
-0.093979 |
0.000000 |
0.228571 |
0.448148 |
32.266667 |
True |
-15.0 |
213.0 |
32.266667 |
0.0 |
0 |
0.0 |
15 |
217 |
-0.159079 |
NaN |
| 2026-04-07 09:50:00+08:00 |
183 |
590 |
Ws_W75 |
1.053488 |
30 |
590.0 |
589.833333 |
591.18 |
591.500000 |
3774.0 |
3930.333333 |
71 |
-1.264045e-01 |
-0.132099 |
-0.104547 |
0.371429 |
0.440376 |
31.266667 |
True |
-10.0 |
19.2 |
31.266667 |
0.0 |
0 |
0.0 |
5 |
1294 |
-0.166183 |
NaN |
| 2026-04-07 11:05:00+08:00 |
183 |
665 |
Ws_W75 |
1.053488 |
30 |
665.0 |
663.000000 |
666.17 |
668.083333 |
3819.0 |
3963.000000 |
70 |
-1.686202e-01 |
-0.177304 |
-0.143801 |
0.222381 |
0.411429 |
28.800000 |
True |
-120.0 |
114.8 |
28.800000 |
0.0 |
0 |
0.0 |
15 |
119 |
-0.230588 |
NaN |