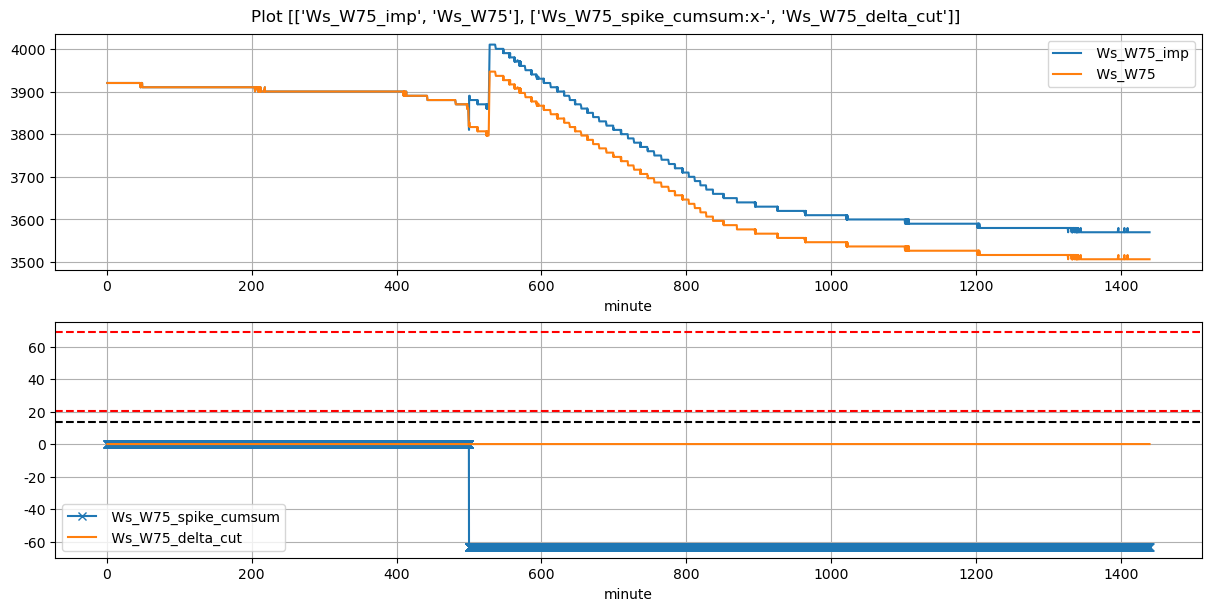
VI and VO Daily Summary
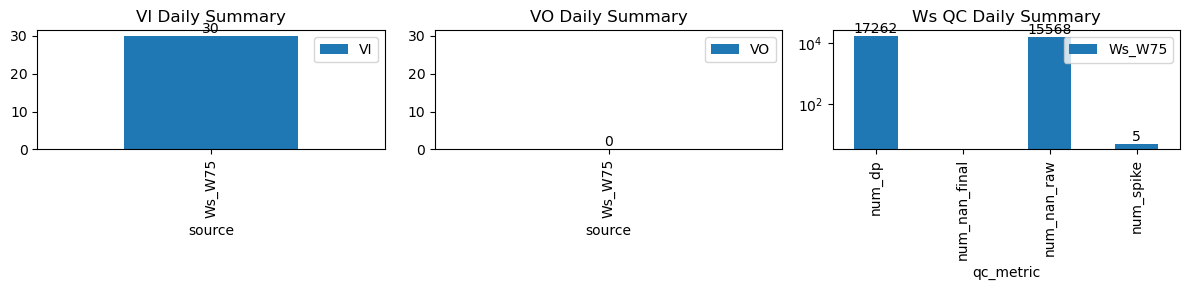
| ws_name | num_dp | num_nan_raw | num_nan_final | num_spike | cum_step_adj |
|---|---|---|---|---|---|
| Ws_W75 | 16,975 | 15,305 | 0 | 5 | -63.33 |
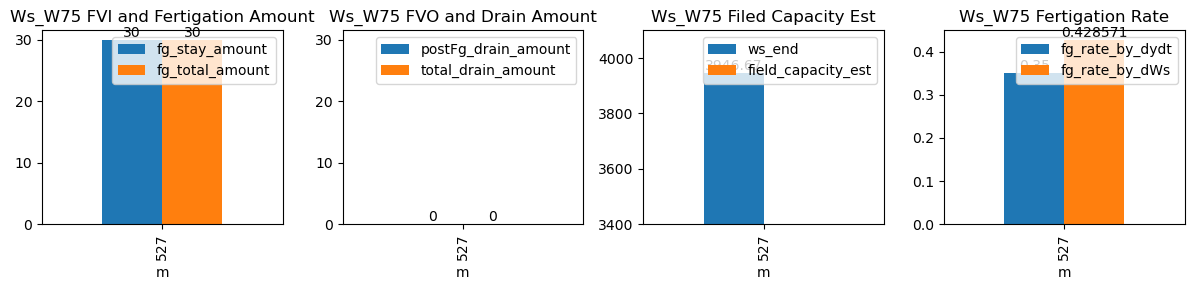
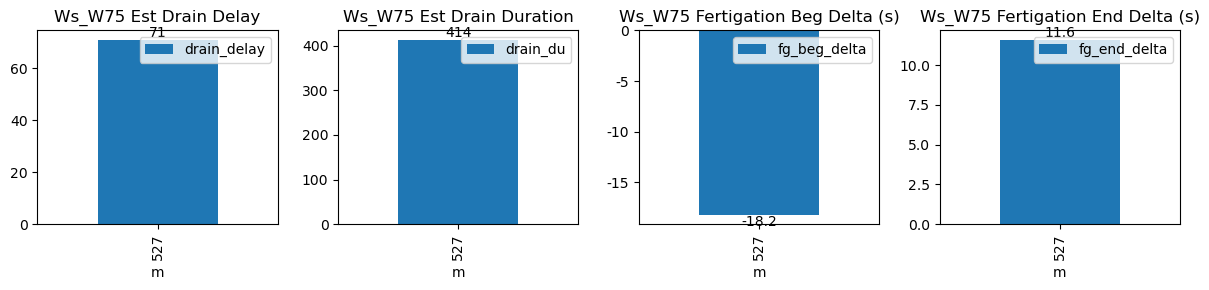
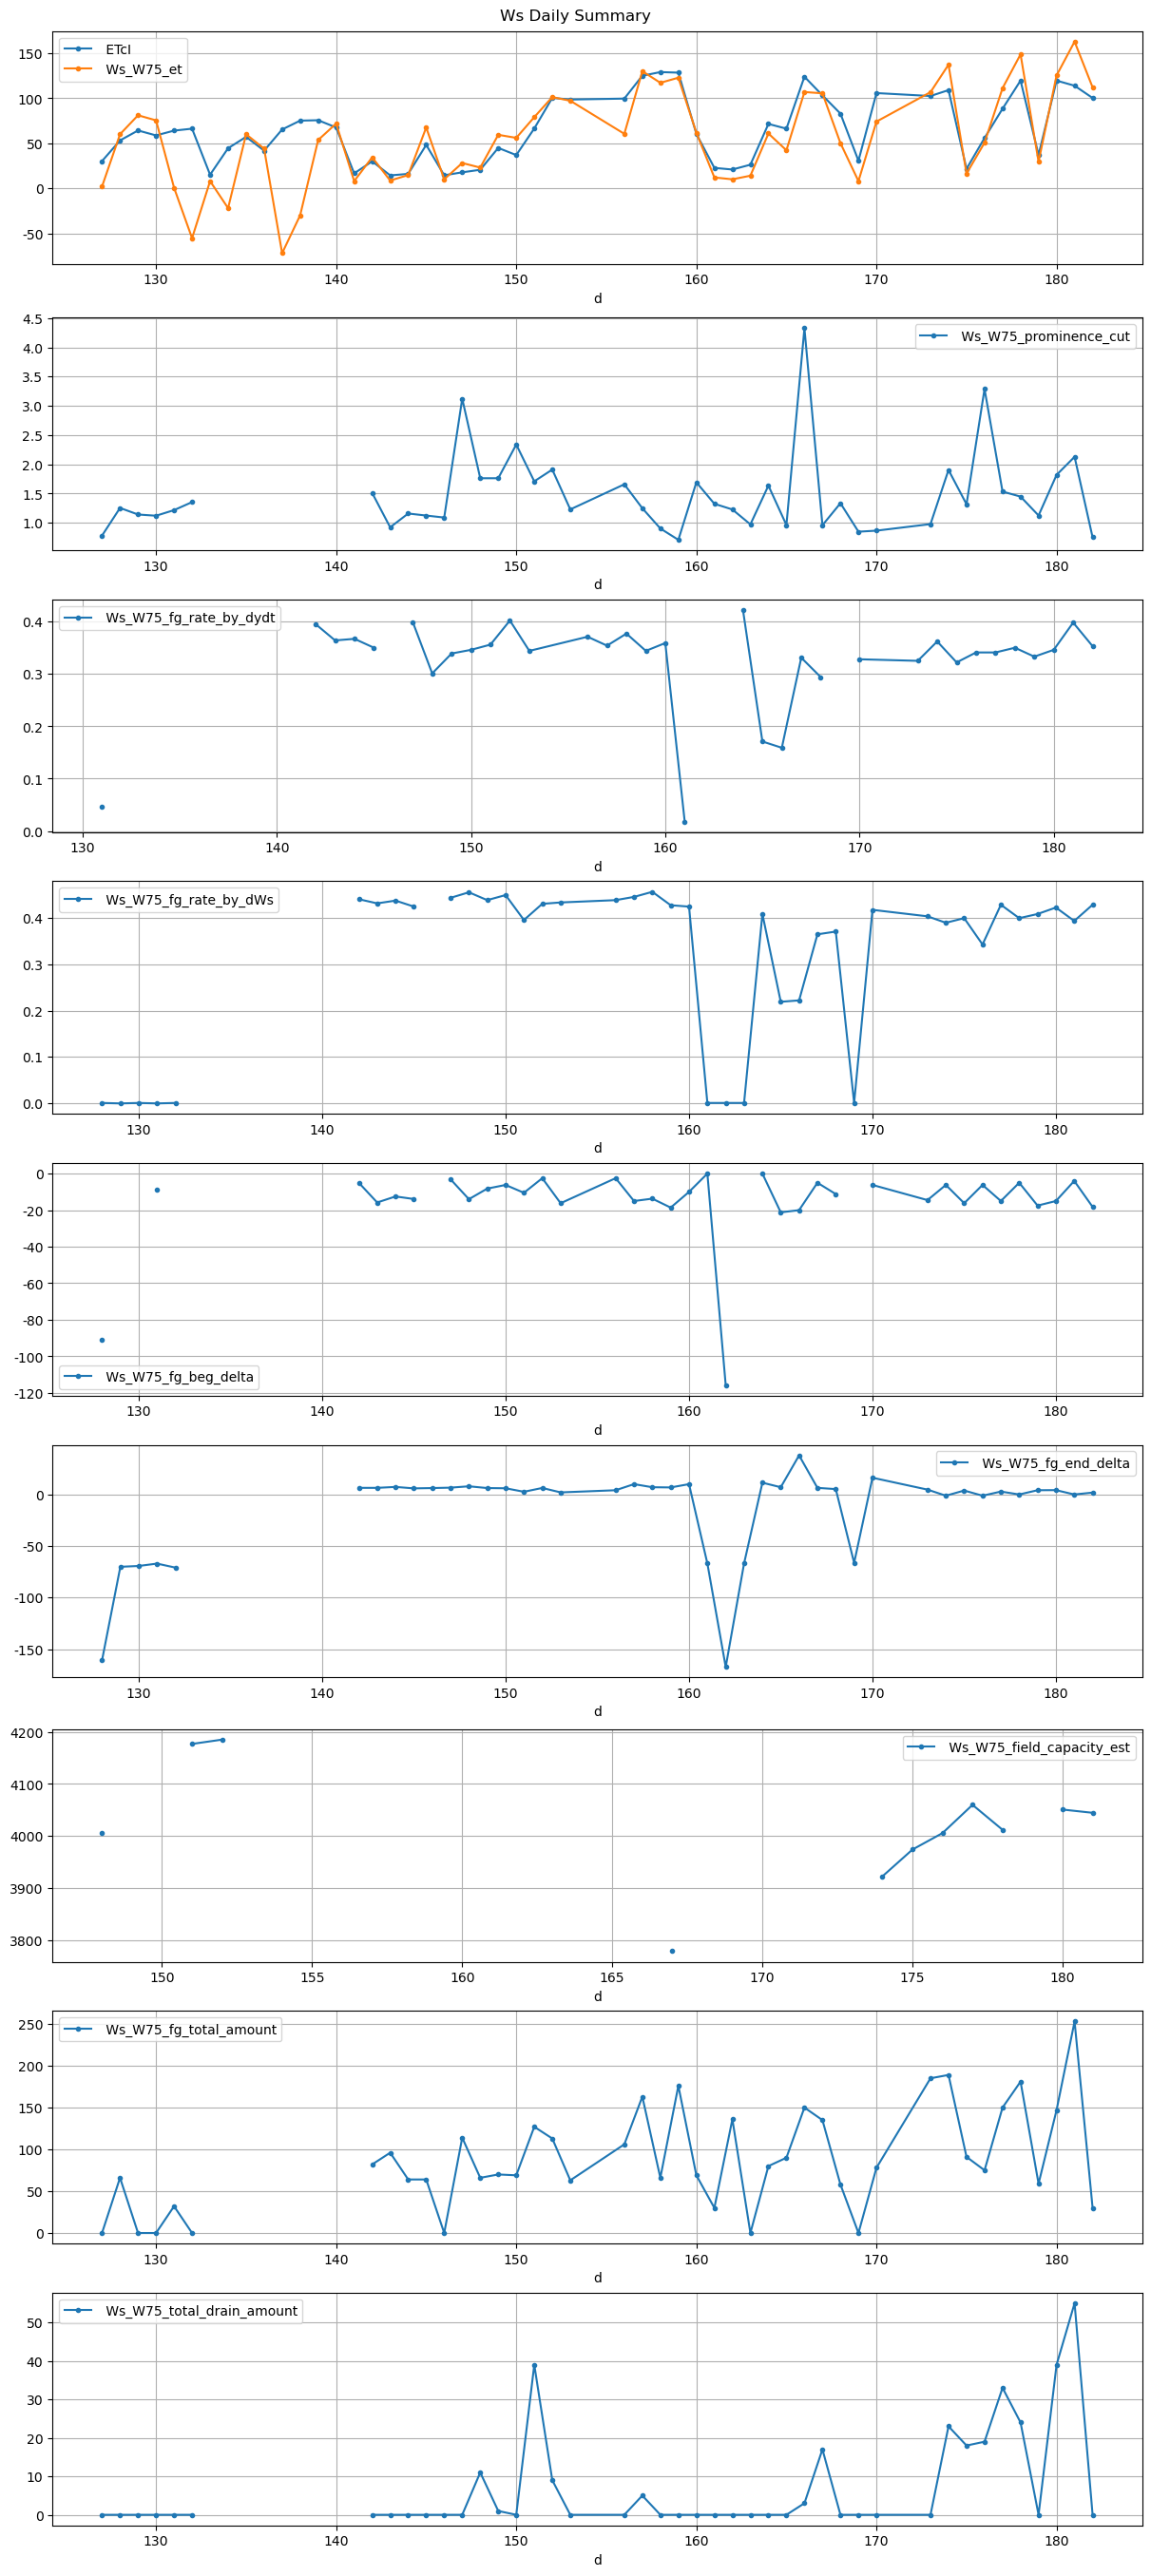
| ds | d | m | ws_name | prominence_cut | max_drain_du | fg_beg | fg_beg_est | fg_end | fg_end_est | ws_beg | ws_end | duc | pre_fg_et | post_fg_ws | post_drn_et | fg_rate_by_dydt | fg_rate_by_dWs | fg_stay_amount | enough_data | fg_beg_delta | fg_end_delta | fg_total_amount | fg_drain_amount | postFg_drain_amount | total_drain_amount | drain_du | drain_delay | drain_rate | field_capacity_est |
|---|---|---|---|---|---|---|---|---|---|---|---|---|---|---|---|---|---|---|---|---|---|---|---|---|---|---|---|---|---|
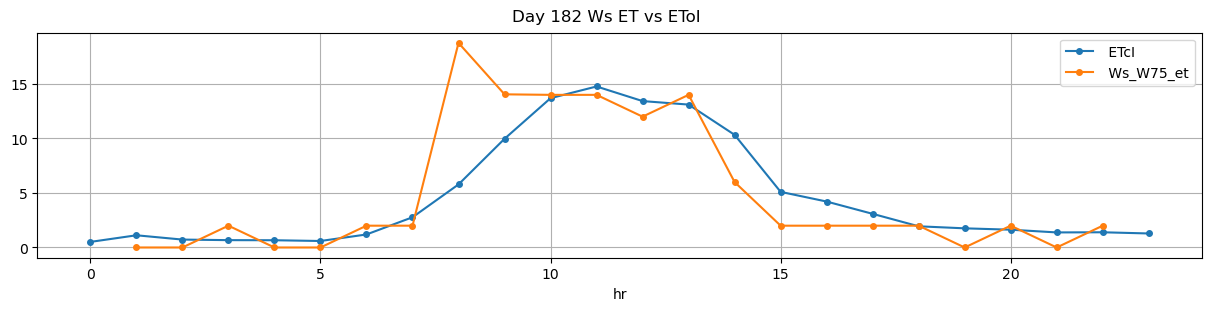
| 2026-04-06 08:47:13+08:00 | 182 | 527 | Ws_W75 | 0.751793 | 30 | 527.22 | 526.916667 | 528.39 | 528.416667 | 3796.666667 | 3946.666667 | 70 | -0.087571 | -0.059722 | -0.104398 | 0.352857 | 0.428571 | 30.0 | True | -18.2 | 1.6 | 30.0 | 0.0 | 0 | 0.0 | 15 | 1606 | -1.548066 | NaN |