| 2026-04-09 07:45:25+08:00 |
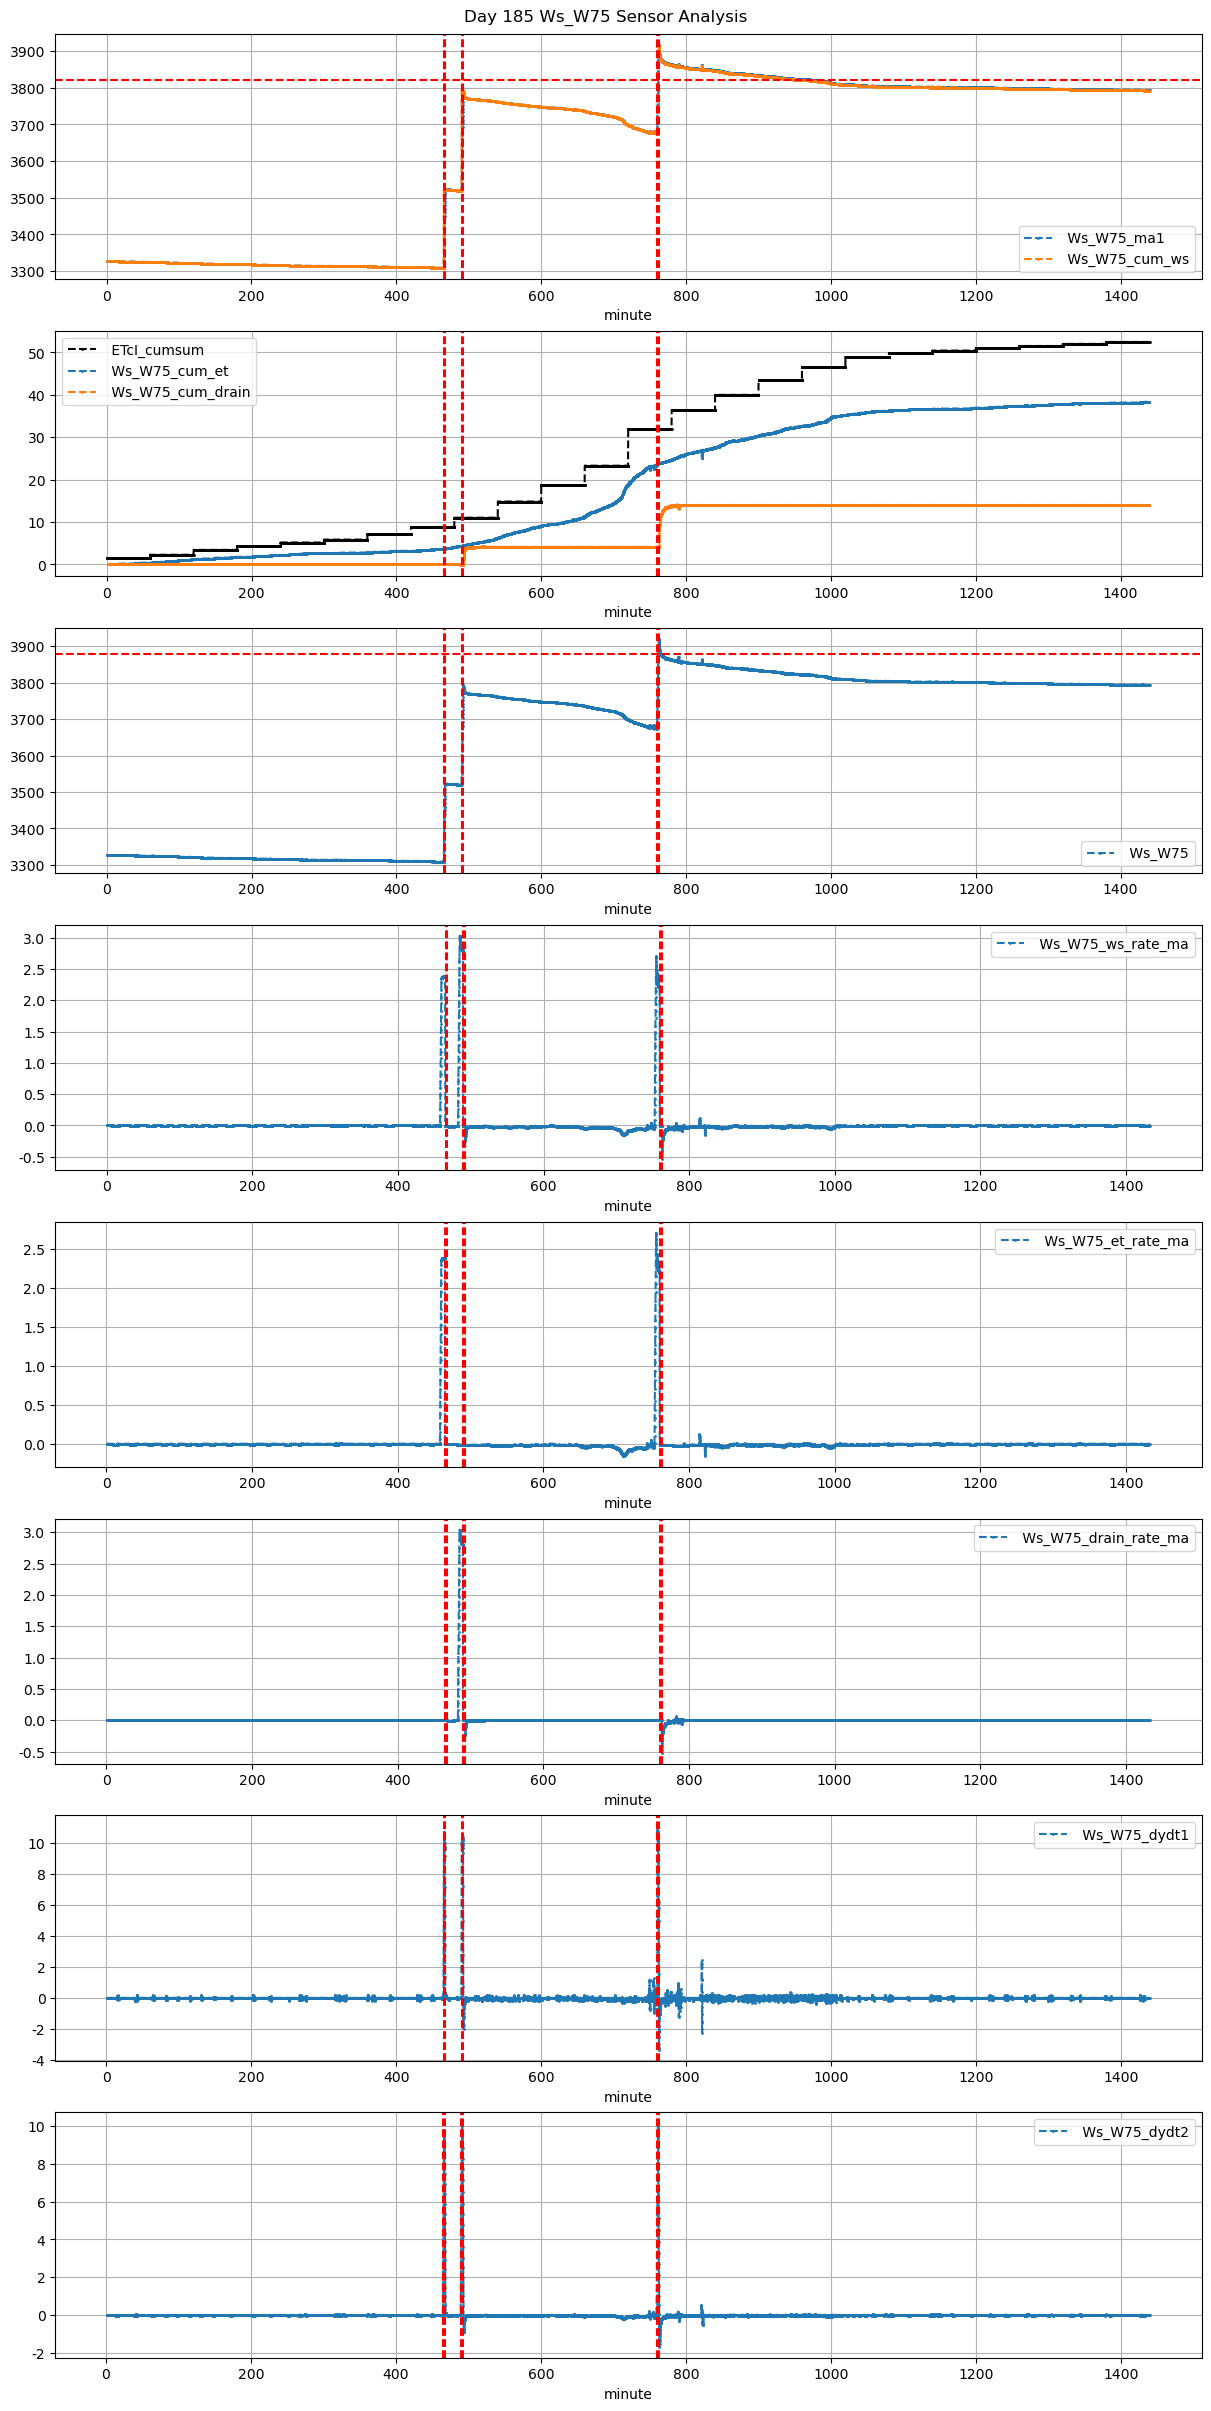
185 |
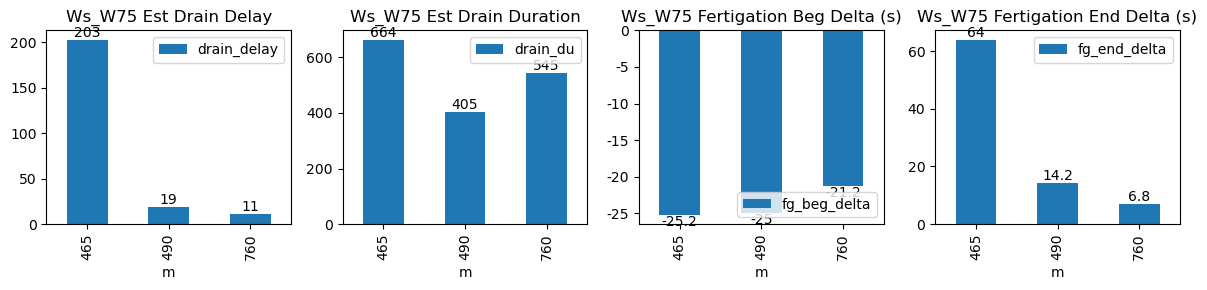
465 |
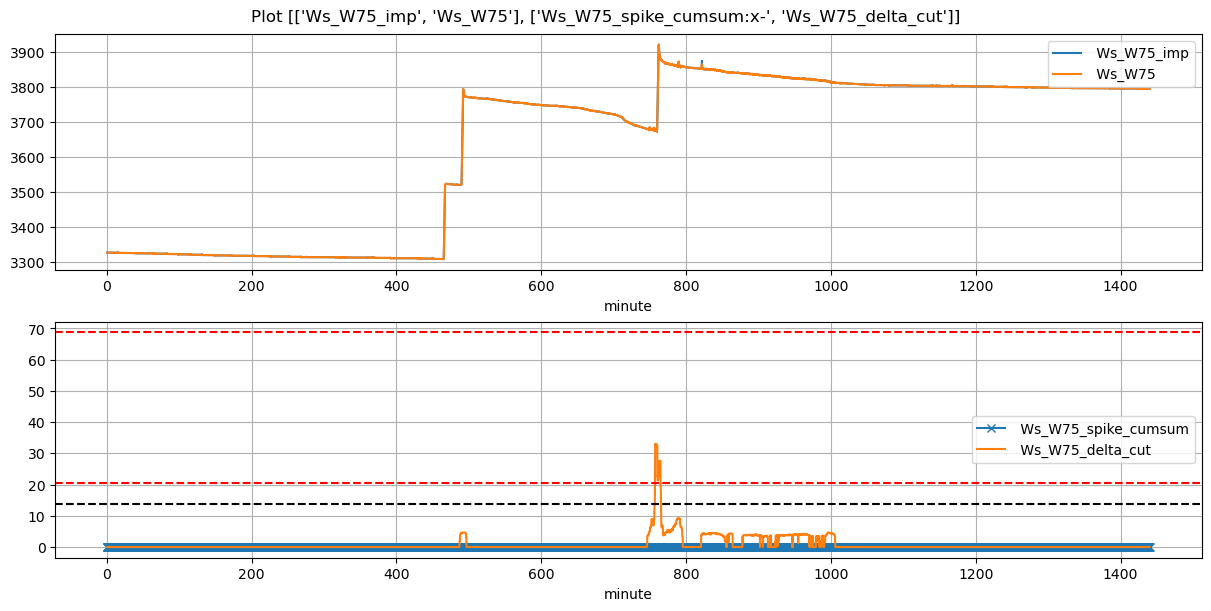
Ws_W75 |
0.357077 |
22.0 |
465.42 |
465.000000 |
467.10 |
468.00 |
3308.686667 |
3523.00 |
101 |
-0.002542 |
-0.017464 |
0.000000 |
0.335730 |
0.424383 |
42.862667 |
True |
-25.2 |
54.0 |
43.329 |
0.000000 |
0.000000 |
0.000000 |
30 |
308 |
-0.152220 |
NaN |
| 2026-04-09 08:10:00+08:00 |
185 |
490 |
Ws_W75 |
0.357077 |
30.0 |
490.00 |
489.583333 |
492.18 |
492.25 |
3520.000000 |
3793.00 |
131 |
-0.013180 |
-0.094444 |
-0.008611 |
0.396325 |
0.416794 |
54.600000 |
True |
-25.0 |
4.2 |
56.199 |
1.600000 |
3.764145 |
5.364145 |
120 |
34 |
-1.762905 |
3774.179277 |
| 2026-04-09 12:40:01+08:00 |
185 |
760 |
Ws_W75 |
0.357077 |
30.0 |
760.02 |
759.666667 |
762.22 |
762.25 |
3676.333333 |
3920.25 |
132 |
-0.011932 |
-0.250394 |
-0.038912 |
0.372492 |
0.369571 |
48.783333 |
True |
-21.2 |
1.8 |
56.628 |
4.820999 |
9.641998 |
14.462997 |
204 |
16 |
-2.810330 |
3872.040010 |