| 2026-04-12 07:44:24+08:00 |
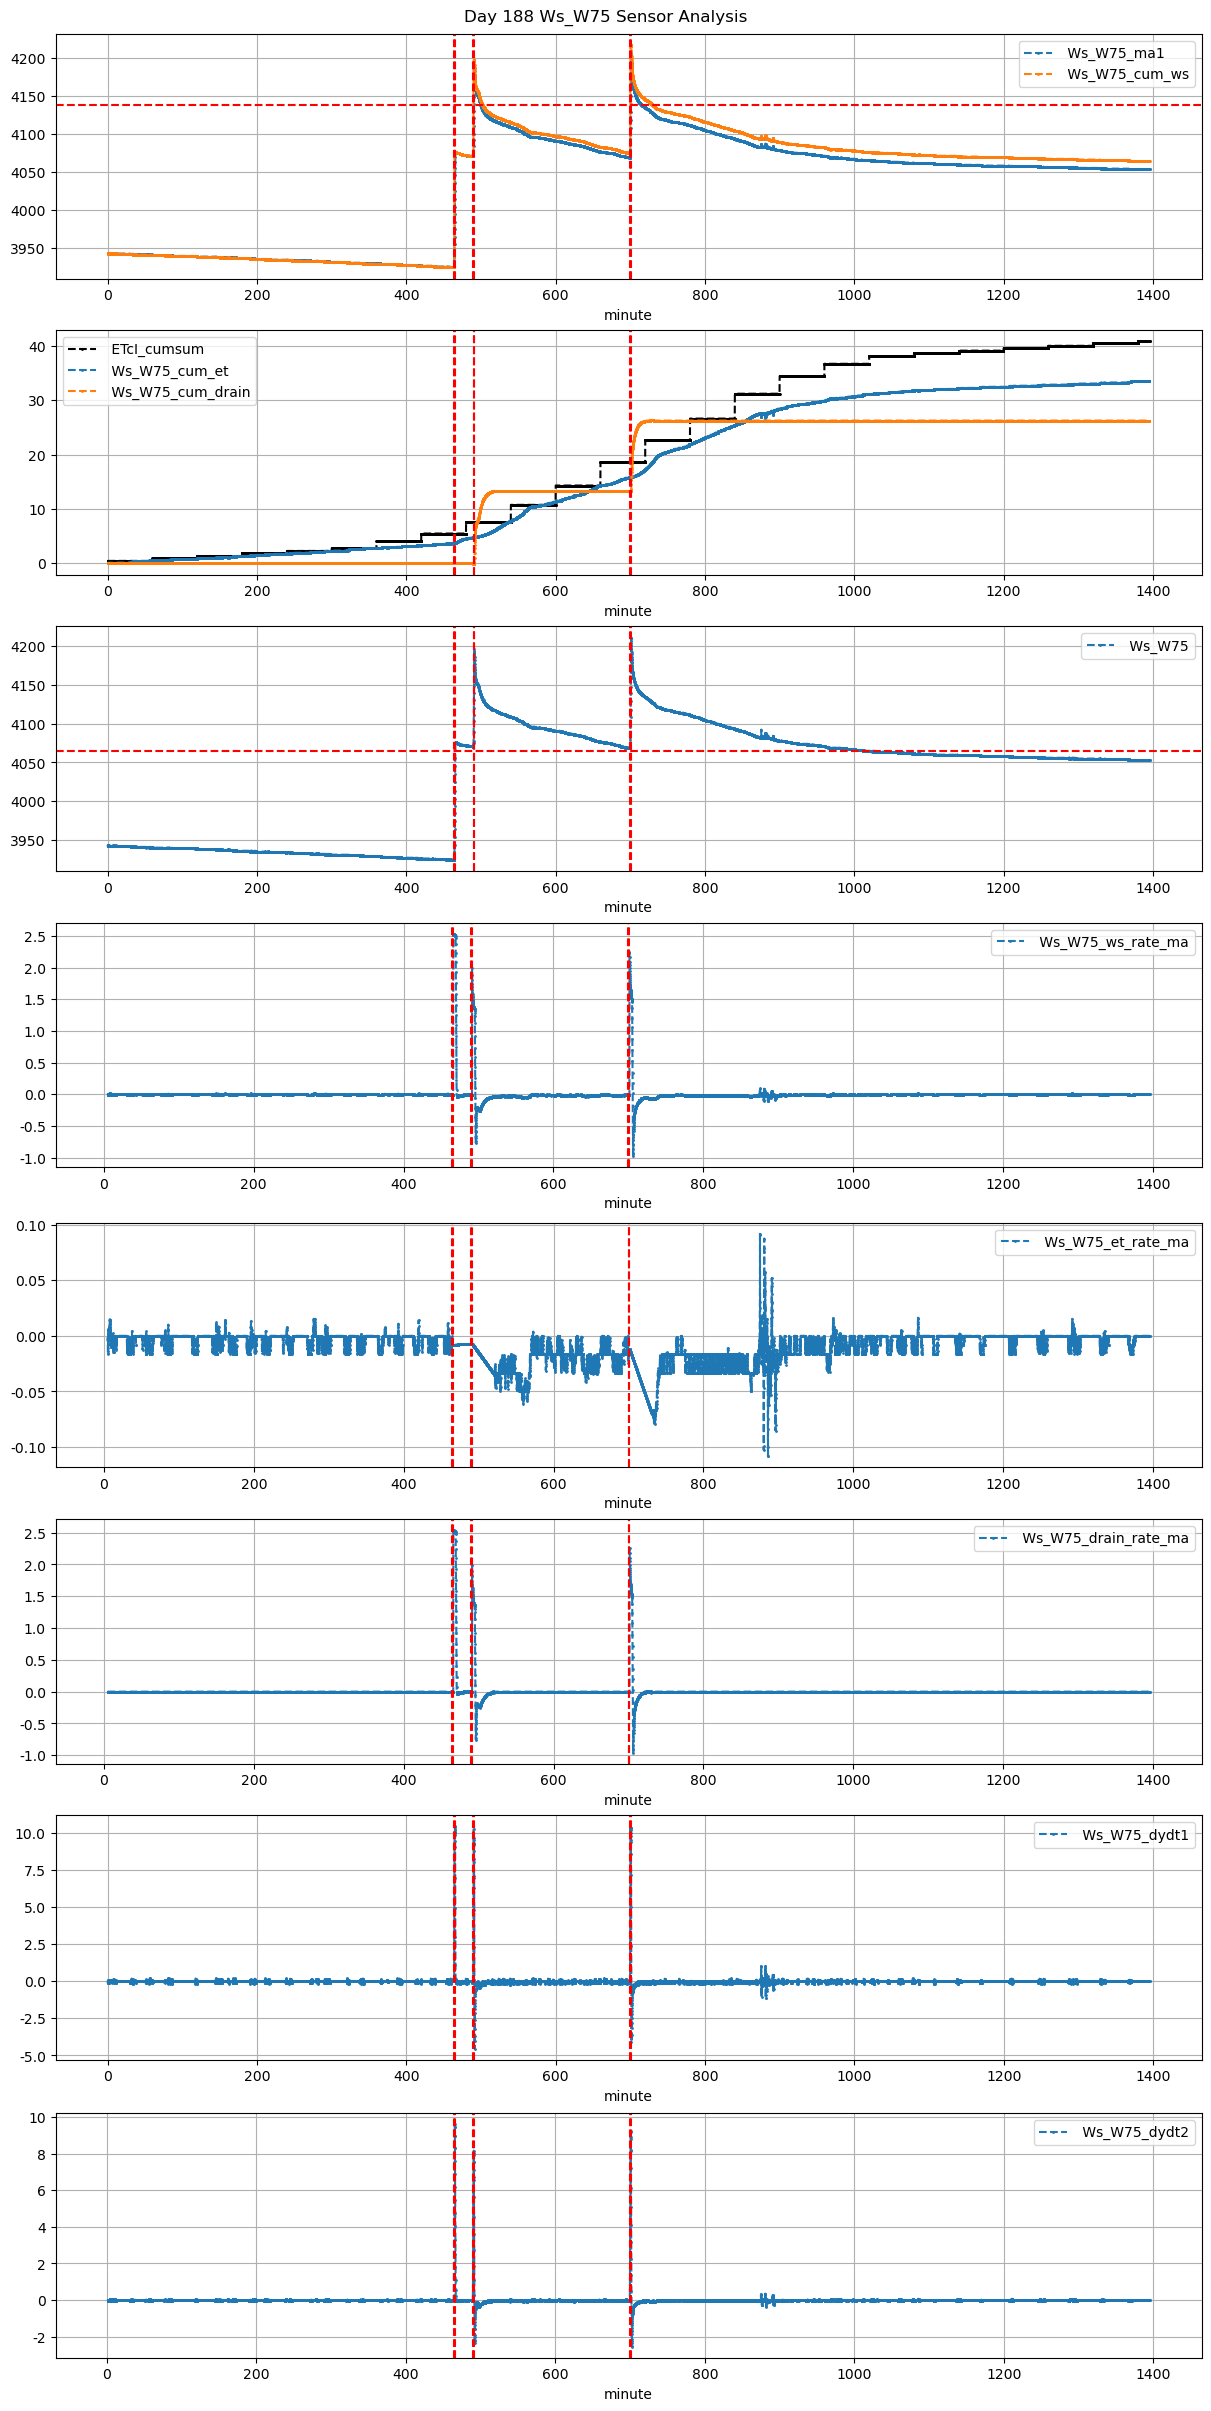
188 |
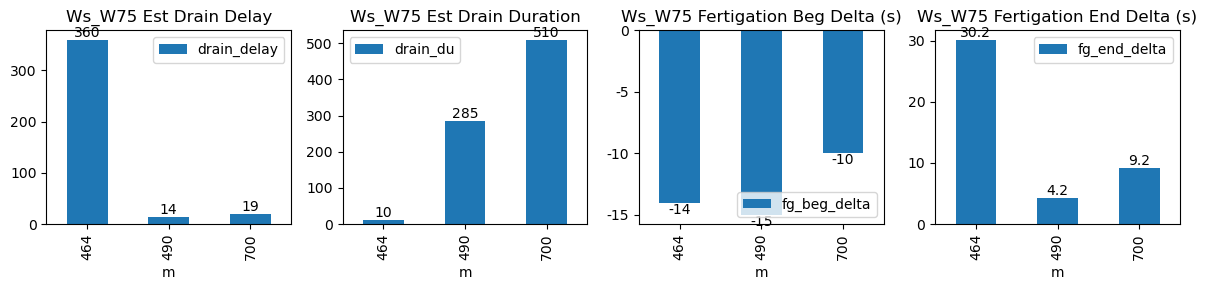
464 |
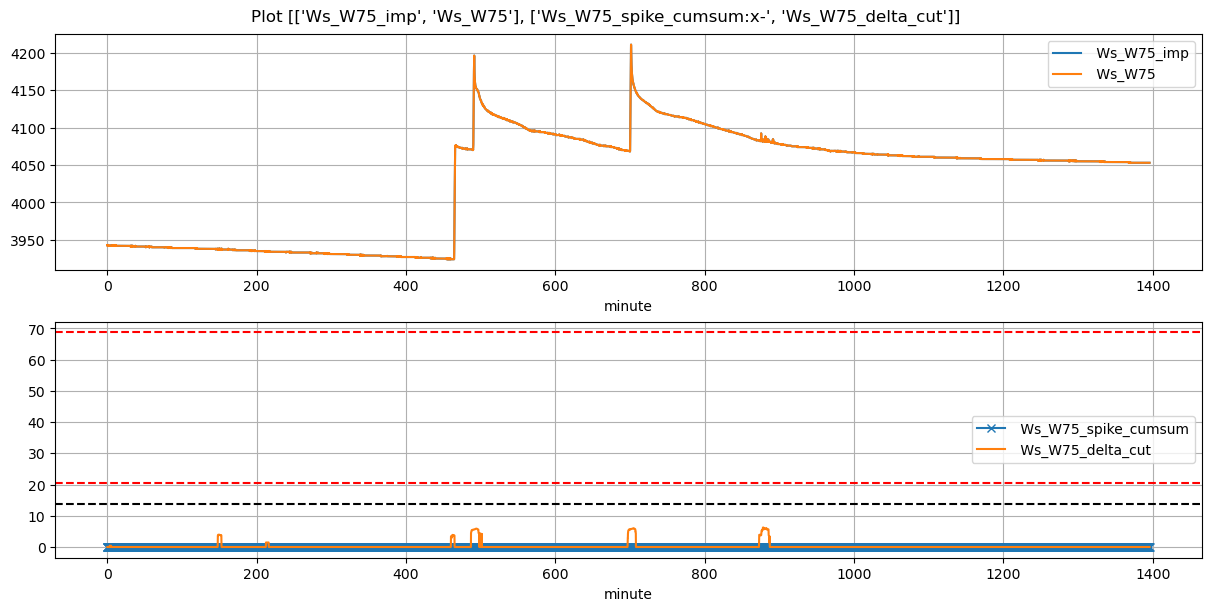
Ws_W75 |
0.420532 |
23.916667 |
464.4 |
464.166667 |
465.58 |
466.083333 |
3924.00 |
4076.000000 |
71 |
-0.008027 |
-0.029819 |
0.000000 |
0.343000 |
0.428169 |
30.400000 |
True |
-14.0 |
30.2 |
31.666 |
0.0 |
0.000000 |
0.000000 |
10 |
360 |
-0.192162 |
NaN |
| 2026-04-12 08:10:00+08:00 |
188 |
490 |
Ws_W75 |
0.420532 |
30.000000 |
490.0 |
489.750000 |
491.18 |
491.250000 |
4070.86 |
4196.333333 |
71 |
-0.007203 |
-0.280597 |
-0.034931 |
0.302198 |
0.353446 |
25.094667 |
True |
-15.0 |
4.2 |
31.666 |
6.6 |
13.337952 |
19.937952 |
285 |
14 |
-3.315461 |
4129.643573 |
| 2026-04-12 11:40:00+08:00 |
188 |
700 |
Ws_W75 |
0.420532 |
30.000000 |
700.0 |
699.833333 |
701.18 |
701.333333 |
4068.83 |
4211.000000 |
71 |
-0.011906 |
-0.335718 |
-0.070208 |
0.338186 |
0.400479 |
28.434000 |
True |
-10.0 |
9.2 |
31.666 |
3.2 |
13.013654 |
16.213654 |
510 |
19 |
-3.427372 |
4145.931728 |