| 2026-04-11 07:28:49+08:00 |
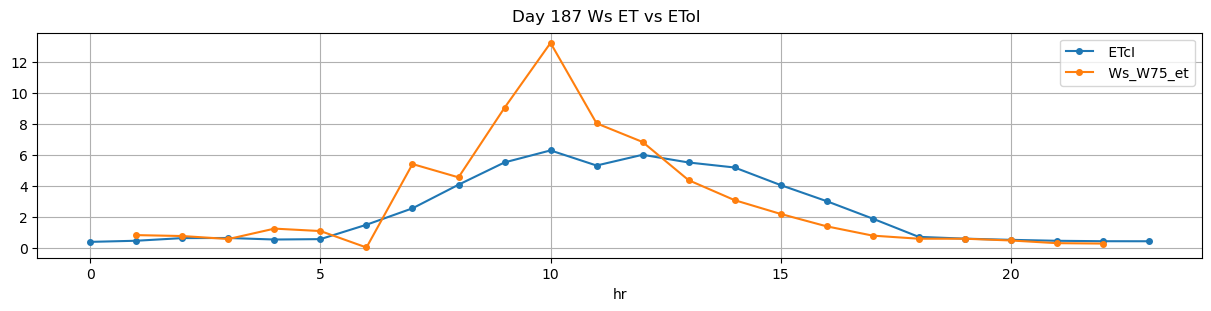
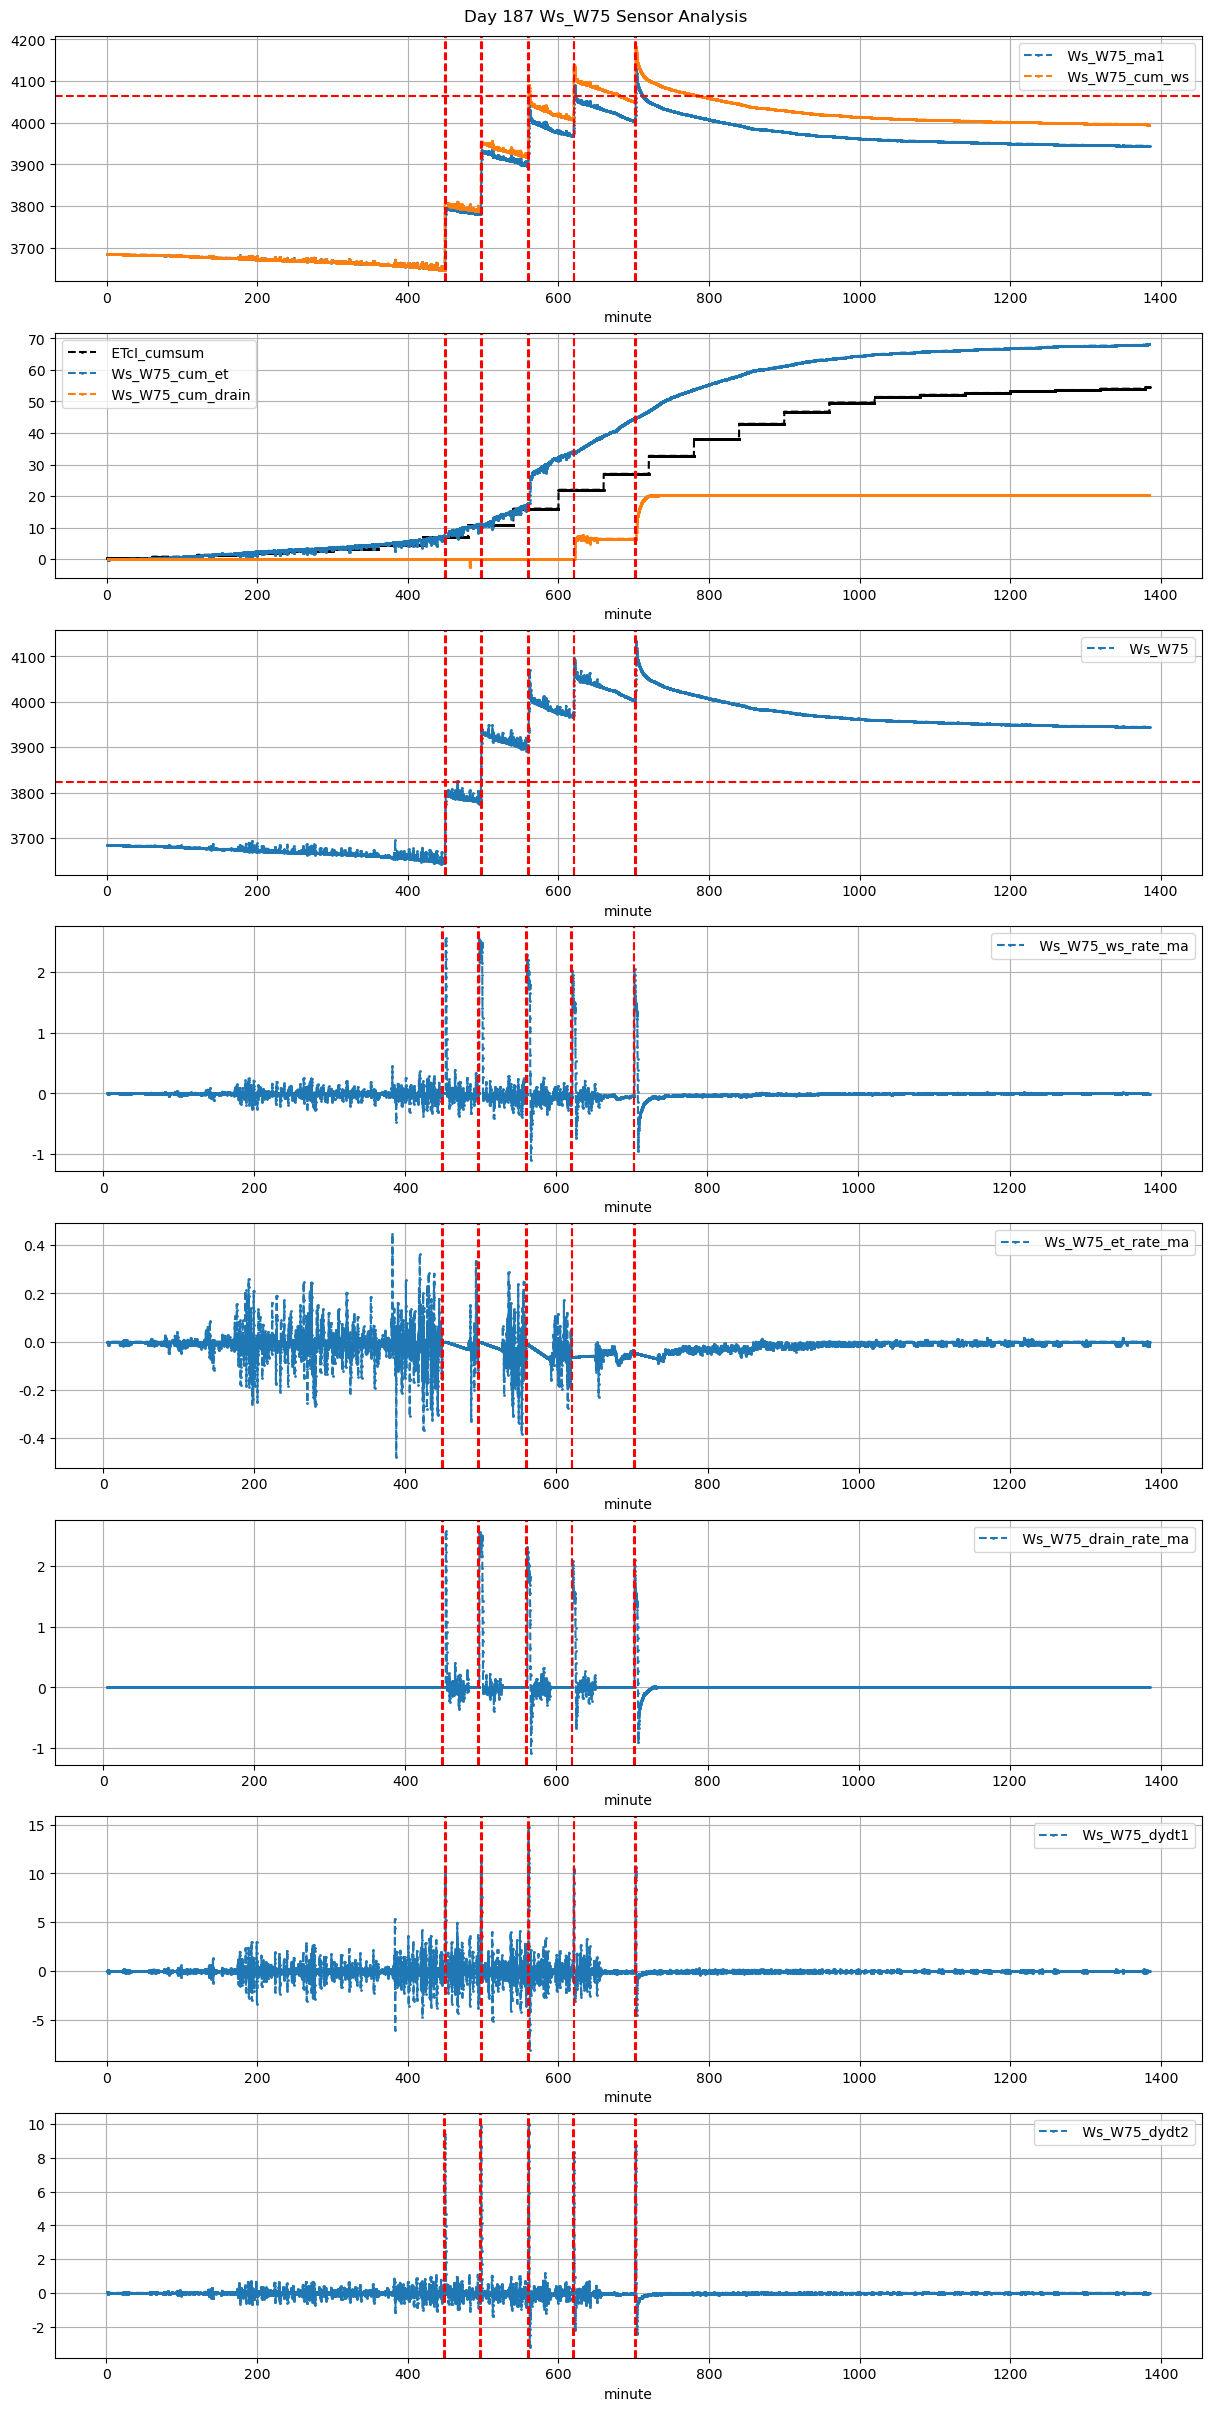
187 |
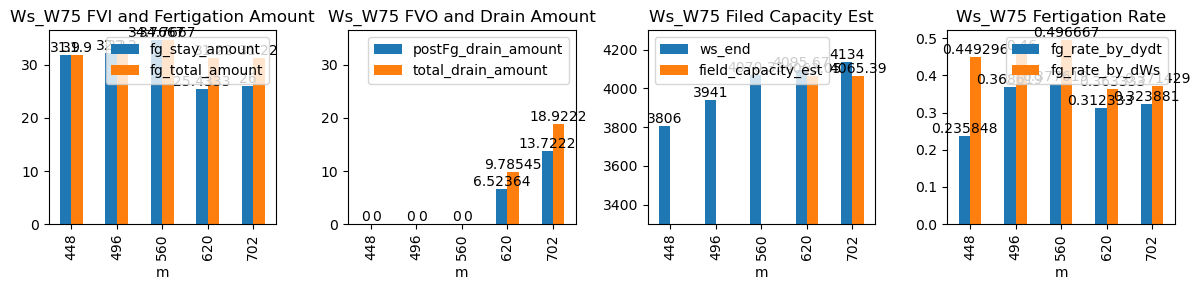
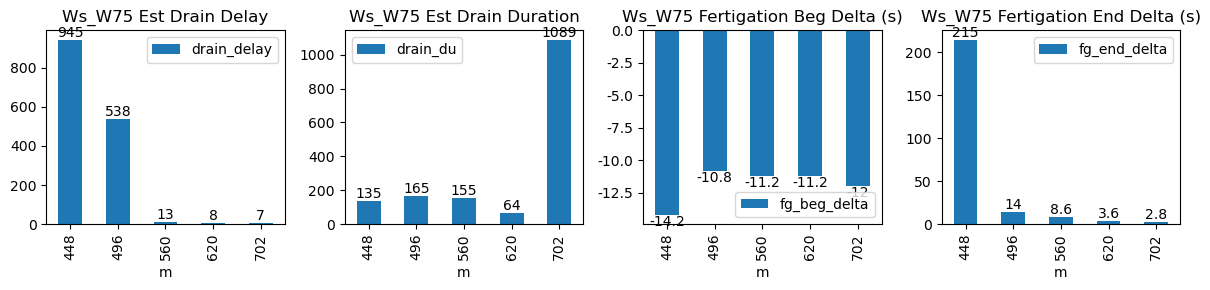
448 |
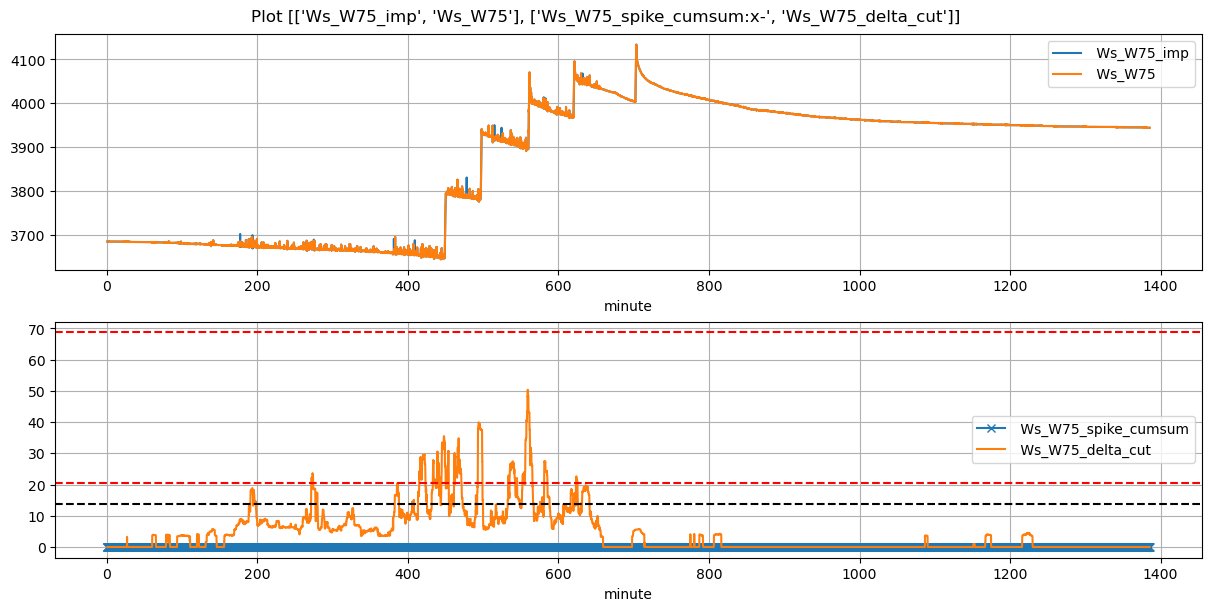
Ws_W75 |
0.714746 |
30 |
448.82 |
448.583333 |
450.00 |
453.500000 |
3646.5 |
3806.000000 |
71 |
0.000000 |
-0.036319 |
-0.031407 |
0.235848 |
0.449296 |
31.900000 |
True |
-14.2 |
210.0 |
31.900000 |
0.000000 |
0.000000 |
0.000000 |
10 |
960 |
-3.419693 |
NaN |
| 2026-04-11 08:16:41+08:00 |
187 |
496 |
Ws_W75 |
0.714746 |
30 |
496.68 |
496.500000 |
497.85 |
497.916667 |
3780.0 |
3941.000000 |
70 |
0.000000 |
-0.029560 |
-0.033627 |
0.368619 |
0.460000 |
32.200000 |
True |
-10.8 |
4.0 |
32.200000 |
0.000000 |
0.000000 |
0.000000 |
15 |
873 |
-3.122581 |
NaN |
| 2026-04-11 09:20:01+08:00 |
187 |
560 |
Ws_W75 |
0.714746 |
30 |
560.02 |
559.833333 |
561.19 |
561.500000 |
3896.5 |
4070.333333 |
70 |
-0.010558 |
-0.190625 |
-0.073912 |
0.377619 |
0.496667 |
34.766667 |
True |
-11.2 |
18.6 |
34.766667 |
0.000000 |
0.000000 |
0.000000 |
20 |
28 |
-5.530535 |
NaN |
| 2026-04-11 10:20:01+08:00 |
187 |
620 |
Ws_W75 |
0.714746 |
30 |
620.02 |
619.833333 |
621.19 |
621.250000 |
3968.5 |
4095.666667 |
70 |
-0.062994 |
-0.175833 |
-0.058273 |
0.312333 |
0.363333 |
25.433333 |
True |
-11.2 |
3.6 |
31.220000 |
3.261818 |
6.523636 |
9.785453 |
84 |
18 |
-2.588413 |
4063.048489 |
| 2026-04-11 11:42:12+08:00 |
187 |
702 |
Ws_W75 |
0.714746 |
30 |
702.20 |
702.000000 |
703.37 |
703.416667 |
4004.0 |
4134.000000 |
70 |
-0.046657 |
-0.400069 |
-0.070579 |
0.323881 |
0.371429 |
26.000000 |
True |
-12.0 |
2.8 |
31.220000 |
5.200000 |
13.722170 |
18.922170 |
574 |
12 |
-3.471732 |
4065.389148 |