| 2026-04-13 07:31:34+08:00 |
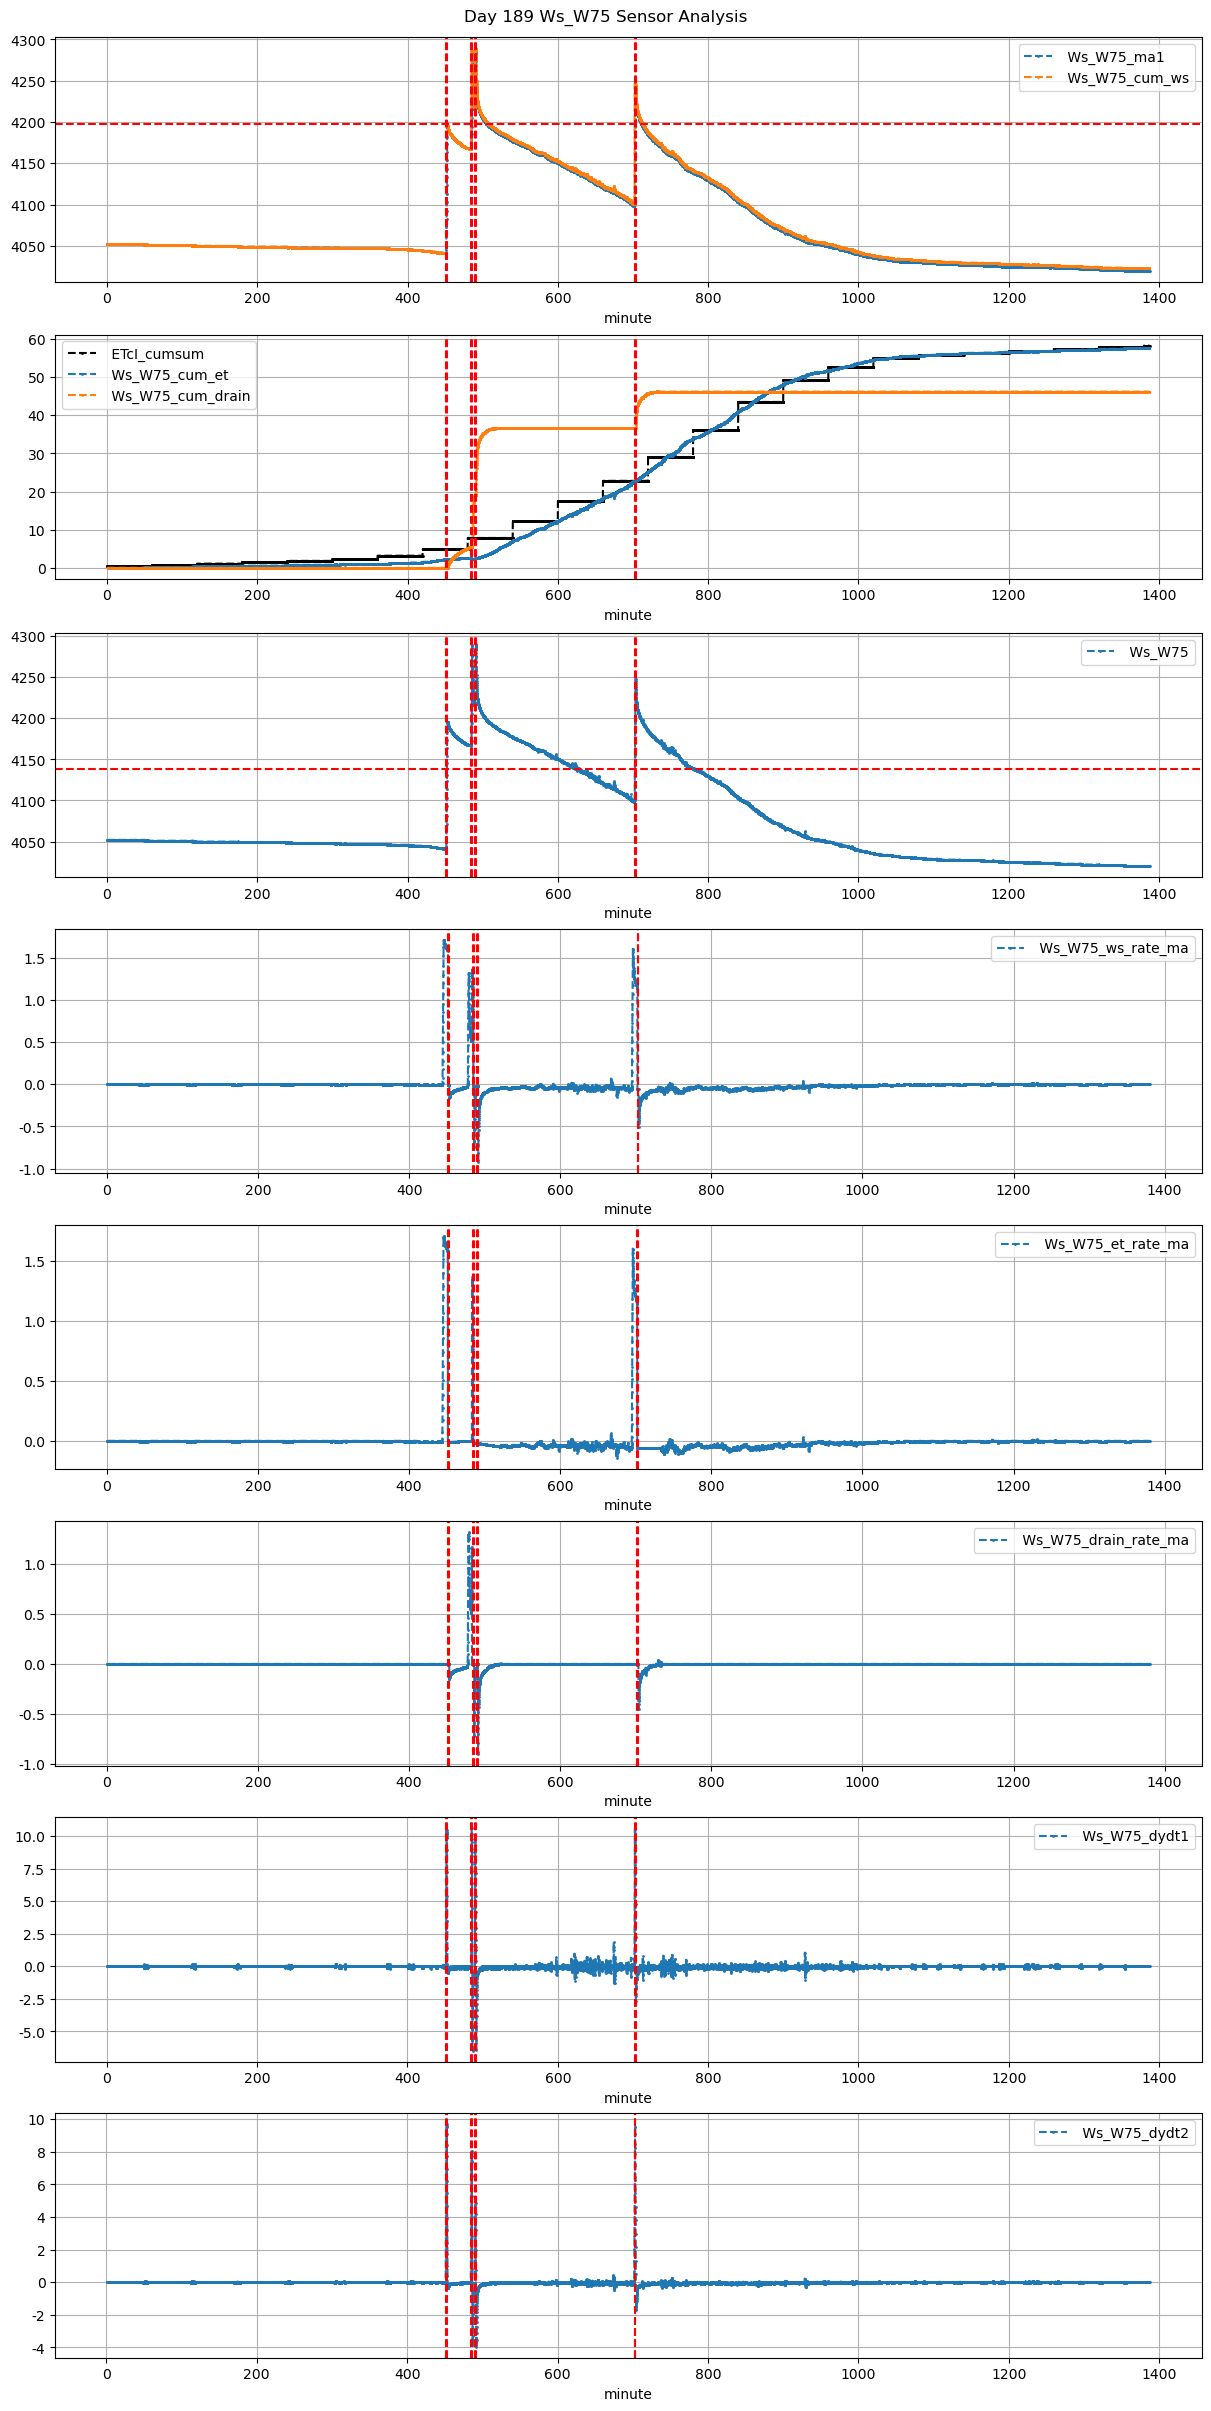
189 |
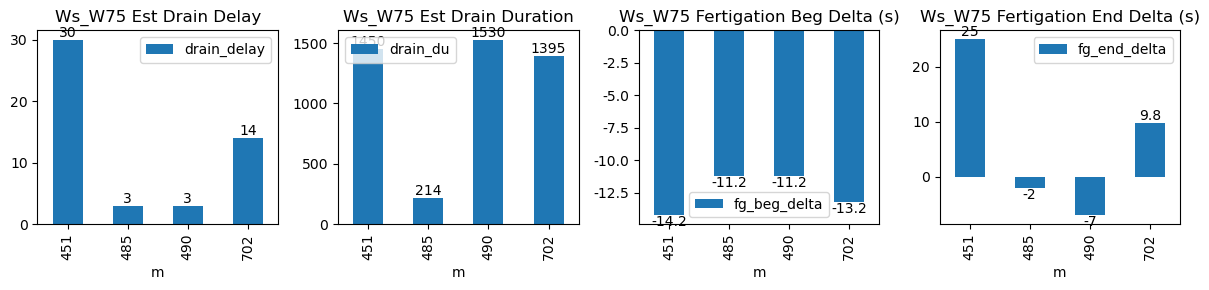
451 |
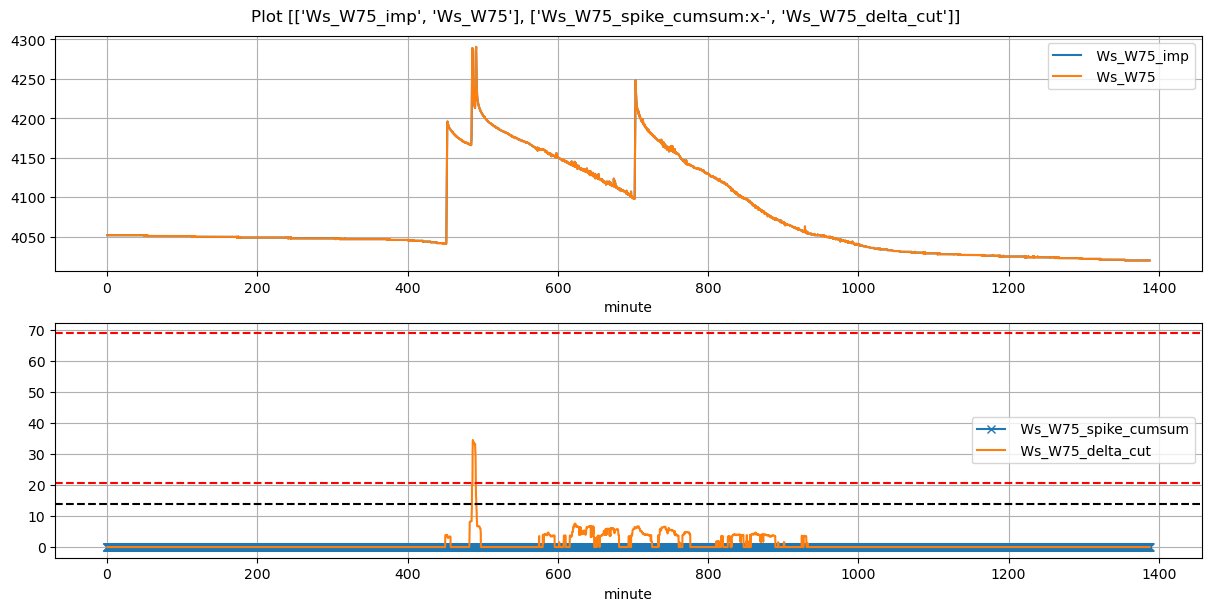
Ws_W75 |
0.744272 |
30.00 |
451.57 |
451.333333 |
452.75 |
453.166667 |
4041.000000 |
4196.0 |
71 |
-0.013559 |
-0.118883 |
0.000000 |
0.351464 |
0.436620 |
31.000000 |
True |
-14.2 |
25.0 |
31.000 |
0.000000 |
5.221318 |
5.221318 |
504 |
40 |
-0.478776 |
4169.893408 |
| 2026-04-13 08:05:01+08:00 |
189 |
485 |
Ws_W75 |
0.744272 |
3.75 |
485.02 |
484.833333 |
486.20 |
486.250000 |
4167.000000 |
4289.0 |
71 |
-0.031427 |
0.000000 |
0.000000 |
0.296242 |
0.343662 |
24.400000 |
True |
-11.2 |
3.0 |
29.607 |
5.200000 |
13.700556 |
18.900556 |
195 |
18 |
-6.350000 |
4220.497222 |
| 2026-04-13 08:10:01+08:00 |
189 |
490 |
Ws_W75 |
0.744272 |
30.00 |
490.02 |
489.833333 |
491.20 |
491.250000 |
4215.400000 |
4290.5 |
71 |
0.000000 |
-0.352824 |
-0.050139 |
0.202726 |
0.211549 |
15.020000 |
True |
-11.2 |
3.0 |
29.607 |
8.720833 |
17.441667 |
26.162500 |
465 |
13 |
-5.224367 |
4203.291667 |
| 2026-04-13 11:42:13+08:00 |
189 |
702 |
Ws_W75 |
0.744272 |
30.00 |
702.22 |
702.000000 |
703.42 |
703.500000 |
4098.794286 |
4248.0 |
72 |
-0.059781 |
-0.287824 |
-0.053264 |
0.349357 |
0.414460 |
29.841143 |
True |
-13.2 |
4.8 |
30.024 |
0.200000 |
9.982338 |
10.182338 |
175 |
14 |
-1.806455 |
4198.088312 |