| 2026-04-14 07:30:01+08:00 |
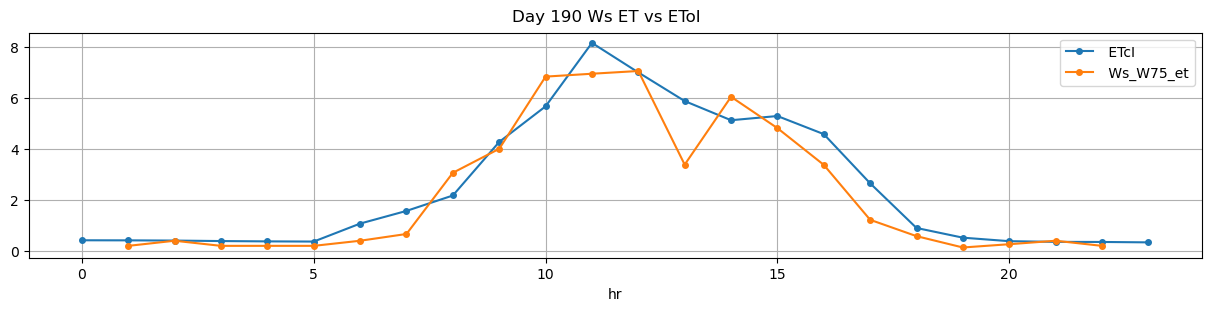
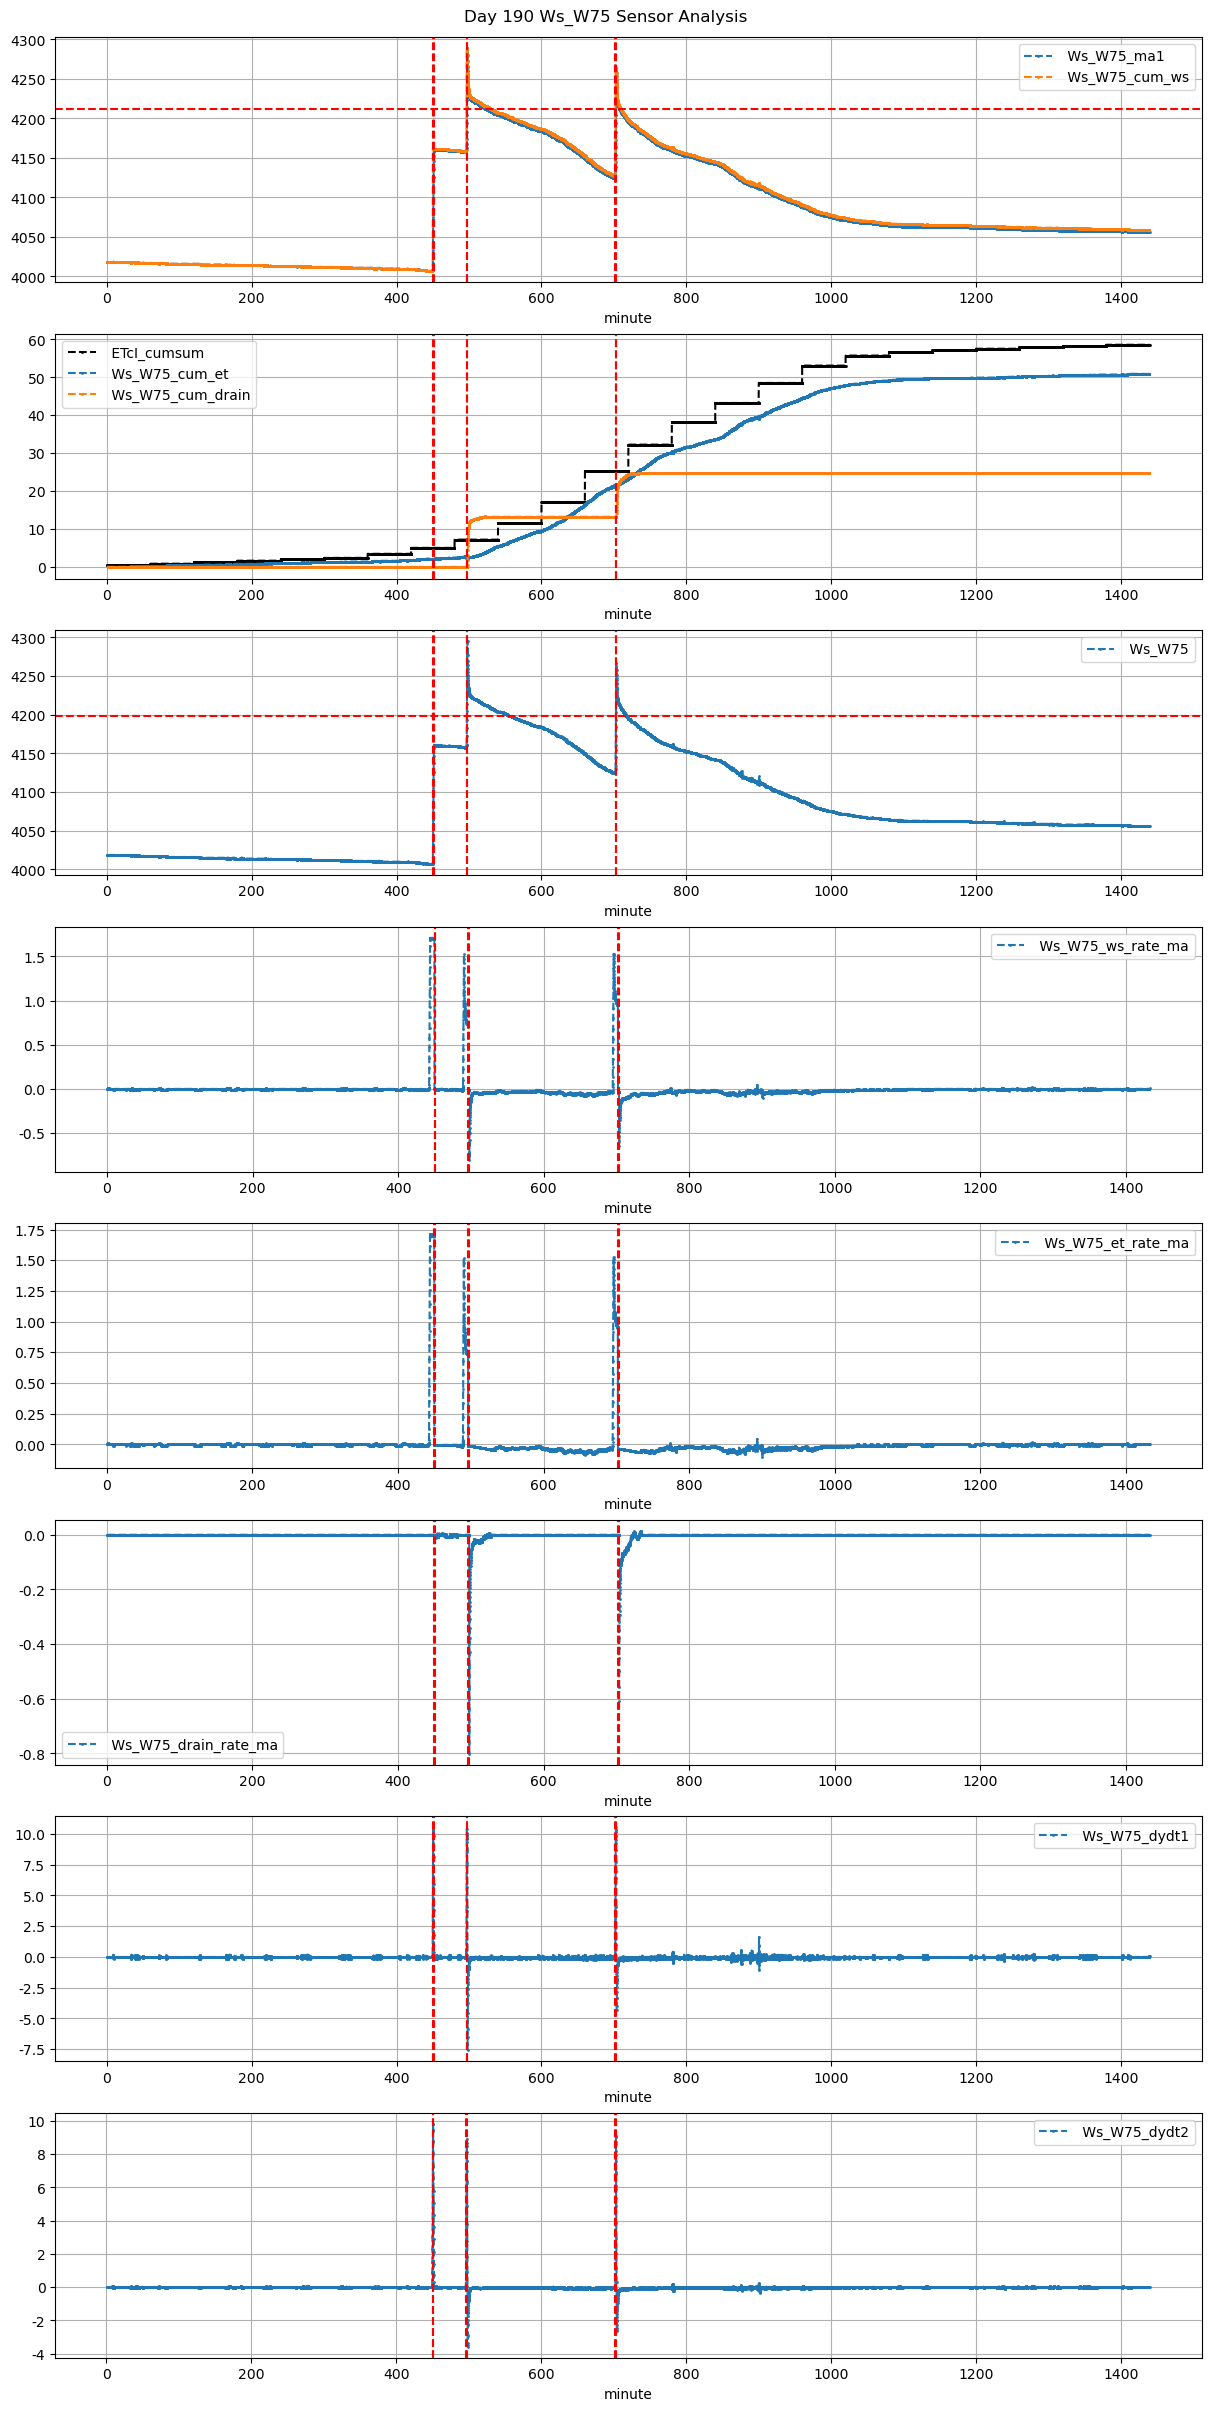
190 |
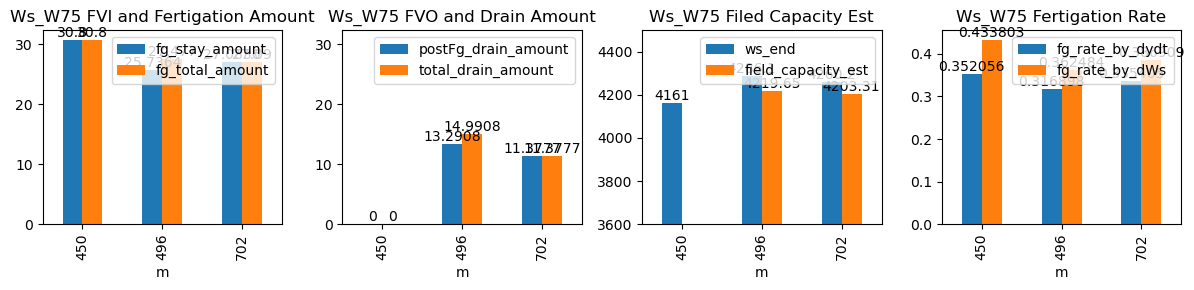
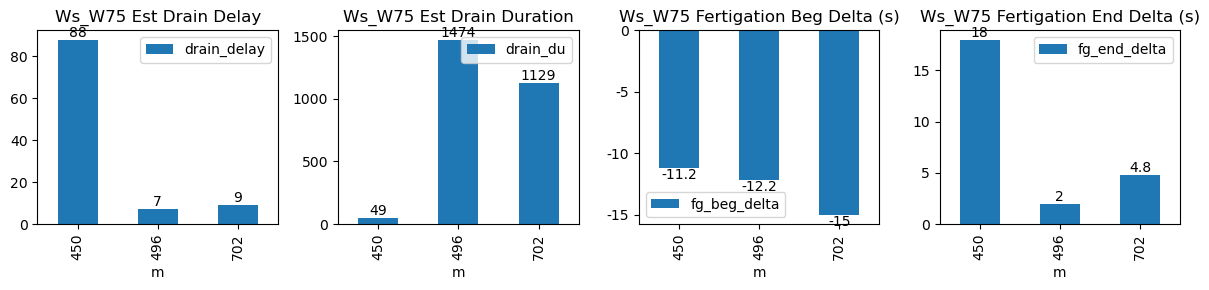
450 |
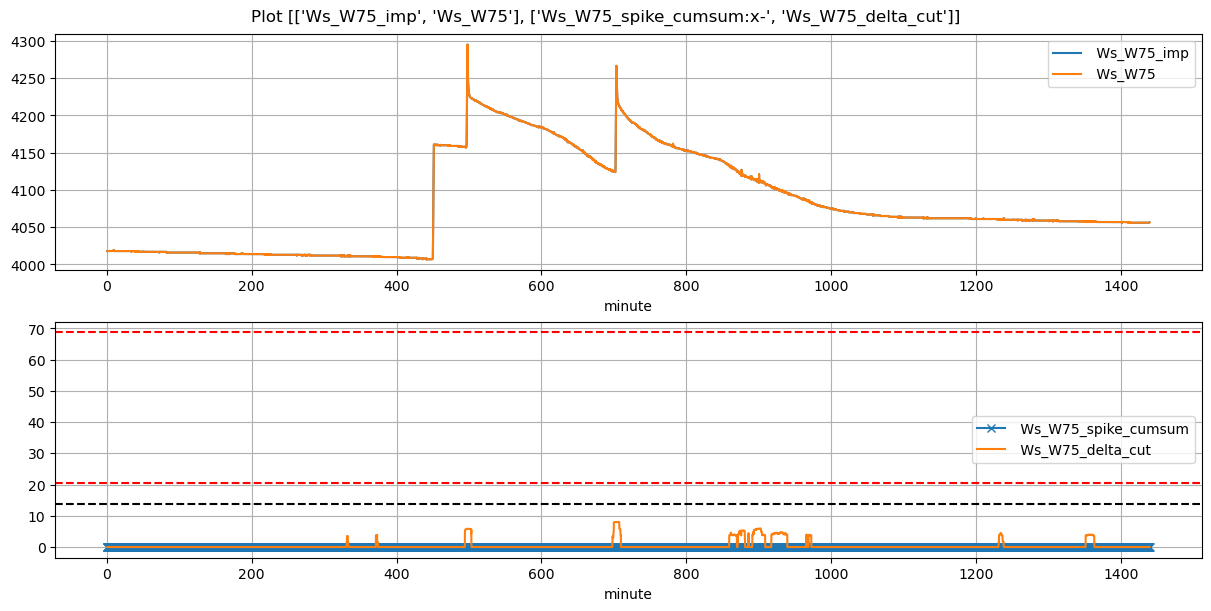
Ws_W75 |
0.493869 |
30 |
450.02 |
449.833333 |
451.20 |
451.500000 |
4007.000000 |
4161.0 |
71 |
-0.008259 |
-0.004630 |
-0.002654 |
0.352056 |
0.433803 |
30.800000 |
True |
-11.2 |
18.0 |
30.800 |
0.0 |
0.000000 |
0.000000 |
49 |
88 |
-0.007771 |
NaN |
| 2026-04-14 08:16:37+08:00 |
190 |
496 |
Ws_W75 |
0.493869 |
30 |
496.62 |
496.416667 |
497.80 |
497.833333 |
4157.418182 |
4286.1 |
71 |
-0.010719 |
-0.125576 |
-0.041293 |
0.316898 |
0.362484 |
25.736364 |
True |
-12.2 |
2.0 |
27.477 |
1.7 |
13.290751 |
14.990751 |
1474 |
7 |
-0.146060 |
4219.646247 |
| 2026-04-14 11:42:15+08:00 |
190 |
702 |
Ws_W75 |
0.493869 |
30 |
702.25 |
702.000000 |
703.42 |
703.500000 |
4124.781818 |
4260.2 |
70 |
-0.034530 |
-0.175854 |
-0.065601 |
0.335405 |
0.386909 |
27.083636 |
True |
-15.0 |
4.8 |
27.090 |
0.0 |
11.377743 |
11.377743 |
1129 |
9 |
-0.171917 |
4203.311287 |