| 2026-04-09 07:42:43+08:00 |
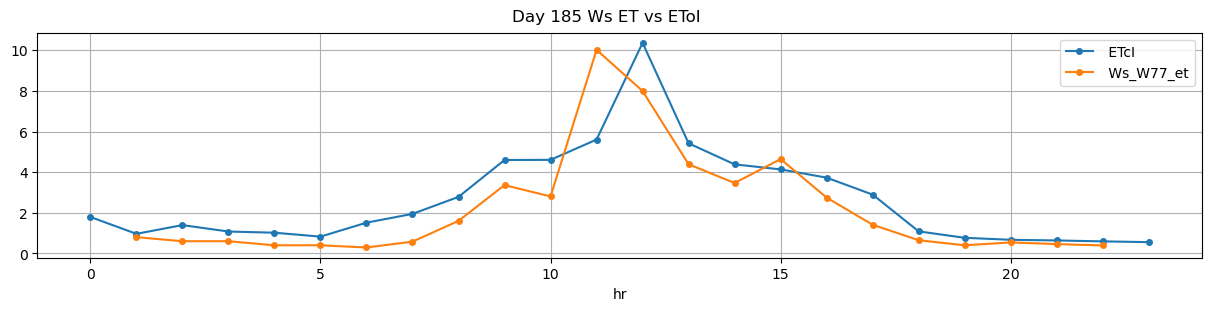
185 |
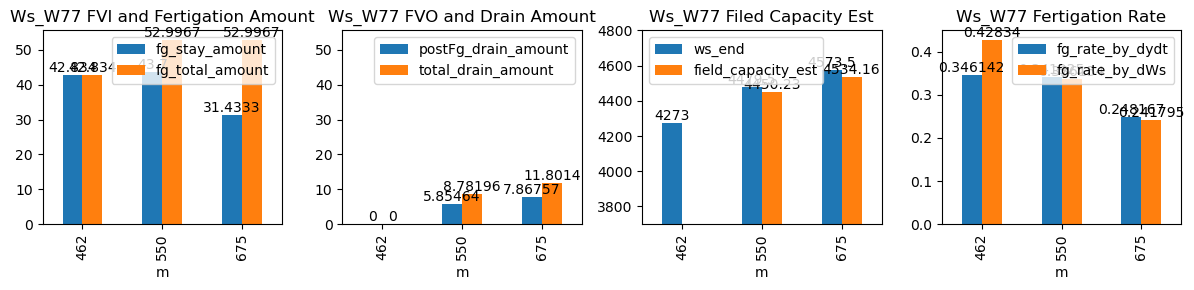
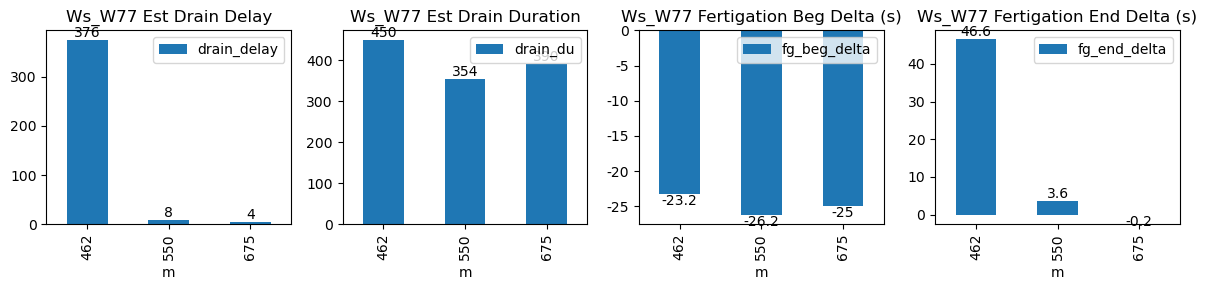
462 |
Ws_W77 |
0.437976 |
30 |
462.72 |
462.333333 |
464.39 |
465.166667 |
4058.830000 |
4273.0 |
100 |
-0.001529 |
-0.013148 |
-0.001312 |
0.346142 |
0.428340 |
42.834000 |
True |
-23.2 |
46.6 |
42.834000 |
0.000000 |
0.000000 |
0.000000 |
450 |
376 |
-0.018106 |
NaN |
| 2026-04-09 09:10:01+08:00 |
185 |
550 |
Ws_W77 |
0.437976 |
30 |
550.02 |
549.583333 |
552.19 |
552.250000 |
4261.000000 |
4479.5 |
130 |
-0.022153 |
-0.062041 |
-0.028769 |
0.341925 |
0.336154 |
43.700000 |
True |
-26.2 |
3.6 |
52.996667 |
2.927320 |
5.854639 |
8.781959 |
354 |
8 |
-0.119589 |
4450.226803 |
| 2026-04-09 11:15:00+08:00 |
185 |
675 |
Ws_W77 |
0.437976 |
30 |
675.00 |
674.583333 |
677.17 |
677.166667 |
4416.333333 |
4573.5 |
130 |
-0.038282 |
-0.107955 |
-0.084938 |
0.248167 |
0.241795 |
31.433333 |
True |
-25.0 |
-0.2 |
52.996667 |
3.933785 |
7.867570 |
11.801355 |
390 |
4 |
-0.194677 |
4534.162150 |