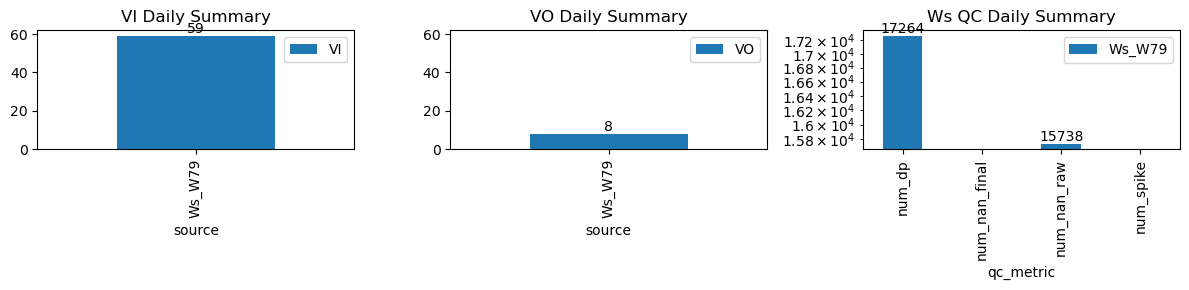
VI and VO Daily Summary
| ws_name | num_dp | num_nan_raw | num_nan_final | num_spike | cum_step_adj |
|---|---|---|---|---|---|
| Ws_W79 | 17,264 | 15,738 | 0 | 0 | 0.00 |
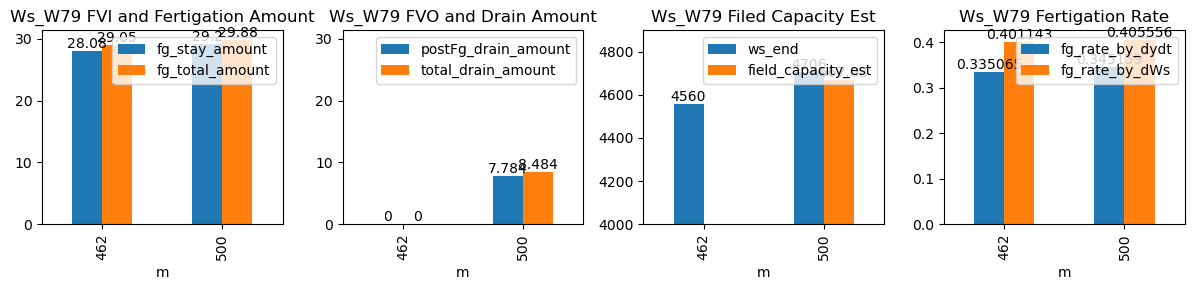
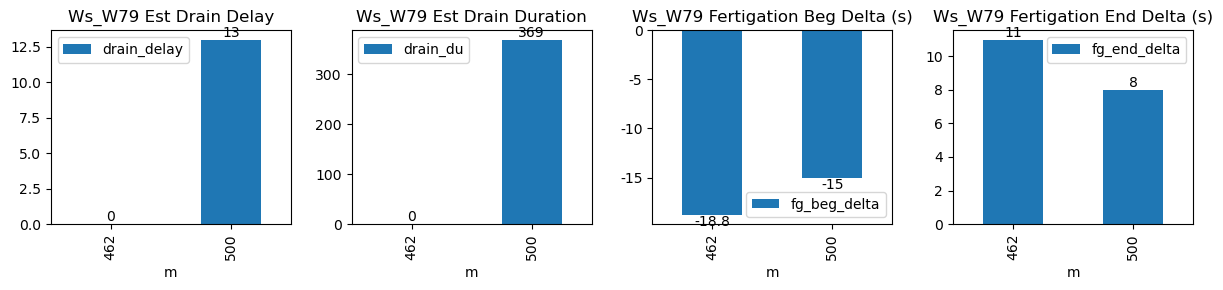
| ds | d | m | ws_name | prominence_cut | max_drain_du | fg_beg | fg_beg_est | fg_end | fg_end_est | ws_beg | ws_end | duc | pre_fg_et | post_fg_ws | post_drn_et | fg_rate_by_dydt | fg_rate_by_dWs | fg_stay_amount | enough_data | fg_beg_delta | fg_end_delta | fg_total_amount | fg_drain_amount | postFg_drain_amount | total_drain_amount | drain_du | drain_delay | drain_rate | field_capacity_est |
|---|---|---|---|---|---|---|---|---|---|---|---|---|---|---|---|---|---|---|---|---|---|---|---|---|---|---|---|---|---|
| 2026-04-03 07:42:14+08:00 | 179 | 462 | Ws_W79 | 1.499989 | 30 | 462.23 | 461.916667 | 463.4 | 463.583333 | 4419.6 | 4560.0 | 70 | -0.014698 | 0.000000 | 0.000000 | 0.335065 | 0.401143 | 28.08 | True | -18.8 | 11.0 | 29.05 | 0.0 | 0.000000 | 0.000000 | NaN | NaN | NaN | NaN |
| 2026-04-03 08:20:00+08:00 | 179 | 500 | Ws_W79 | 1.499989 | 30 | 500.00 | 499.750000 | 501.2 | 501.333333 | 4560.0 | 4706.0 | 72 | -0.016012 | -0.134568 | -0.059568 | 0.345159 | 0.405556 | 29.20 | True | -15.0 | 8.0 | 29.88 | 0.7 | 7.783995 | 8.483995 | 369.0 | 13.0 | -0.212702 | 4667.080023 |