VI and VO Daily Summary
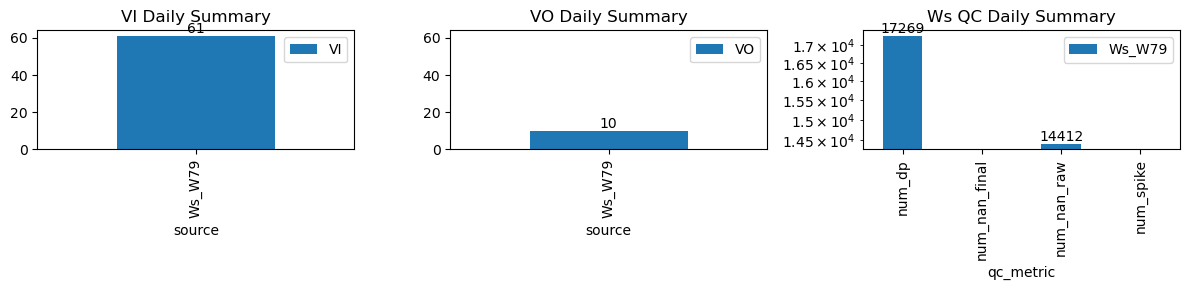
| ws_name | num_dp | num_nan_raw | num_nan_final | num_spike | cum_step_adj |
|---|---|---|---|---|---|
| Ws_W79 | 16,743 | 13,965 | 0 | 0 | 0.00 |
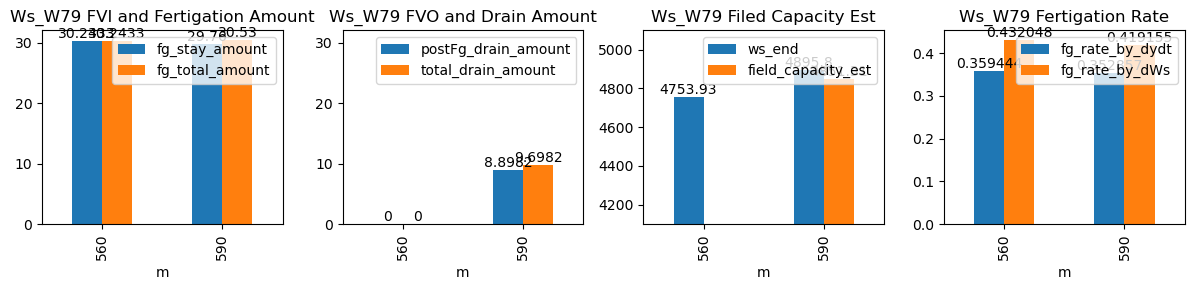
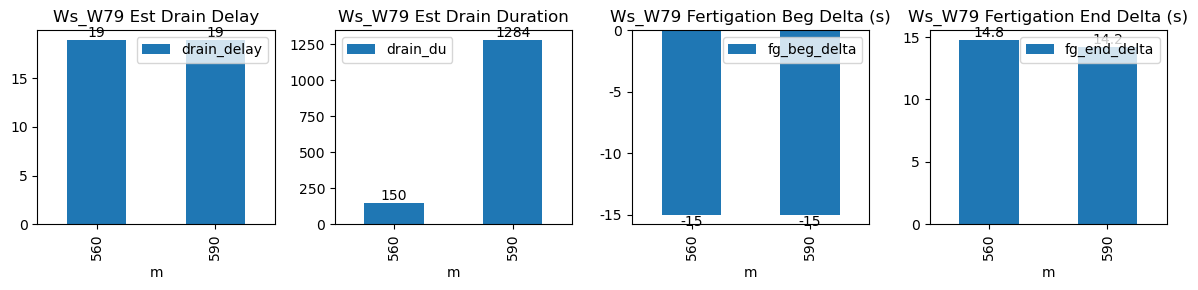
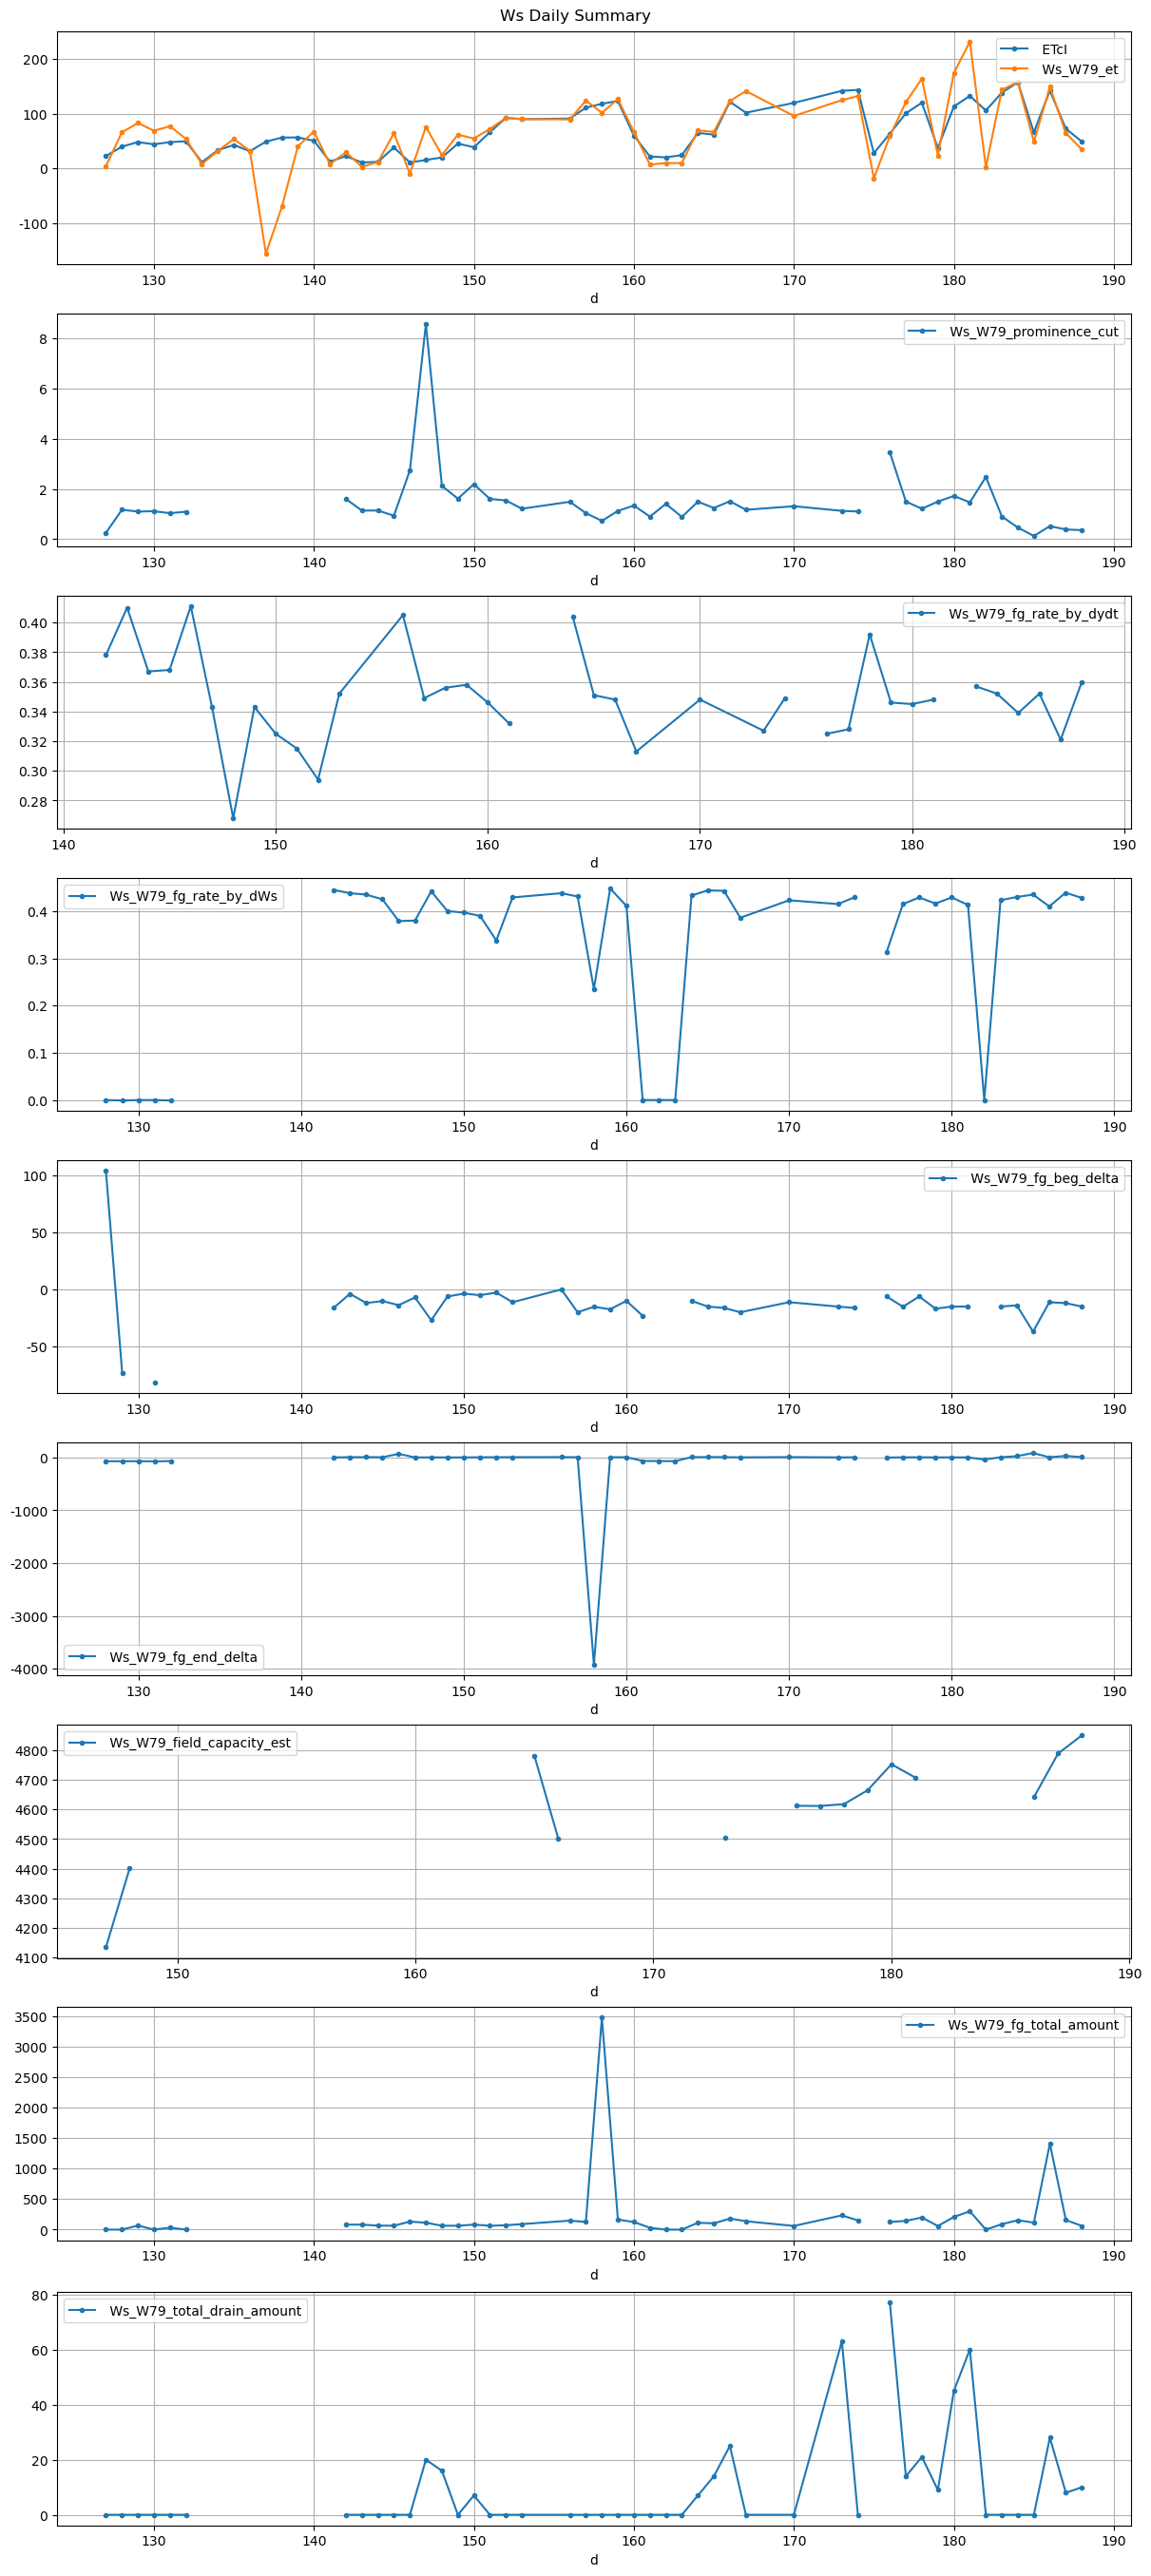
| ds | d | m | ws_name | prominence_cut | max_drain_du | fg_beg | fg_beg_est | fg_end | fg_end_est | ws_beg | ws_end | duc | pre_fg_et | post_fg_ws | post_drn_et | fg_rate_by_dydt | fg_rate_by_dWs | fg_stay_amount | enough_data | fg_beg_delta | fg_end_delta | fg_total_amount | fg_drain_amount | postFg_drain_amount | total_drain_amount | drain_du | drain_delay | drain_rate | field_capacity_est |
|---|---|---|---|---|---|---|---|---|---|---|---|---|---|---|---|---|---|---|---|---|---|---|---|---|---|---|---|---|---|
| 2026-04-12 09:20:00+08:00 | 188 | 560 | Ws_W79 | 0.36123 | 28.75 | 560.0 | 559.75 | 561.17 | 561.250000 | 4602.5 | 4754.0 | 70 | -0.033117 | -0.031806 | 0.000000 | 0.364667 | 0.432857 | 30.3 | True | -15.0 | 4.8 | 30.30 | 0.0 | 0.000000 | 0.000000 | 15 | 1524 | -0.168184 | NaN |
| 2026-04-12 09:50:00+08:00 | 188 | 590 | Ws_W79 | 0.36123 | 30.00 | 590.0 | 589.75 | 591.18 | 591.333333 | 4747.0 | 4897.0 | 71 | -0.011972 | -0.226693 | -0.043194 | 0.355357 | 0.422535 | 30.0 | True | -15.0 | 9.2 | 30.53 | 0.5 | 9.485043 | 9.985043 | 309 | 34 | -3.497393 | 4849.574784 |