| 2026-04-13 07:27:10+08:00 |
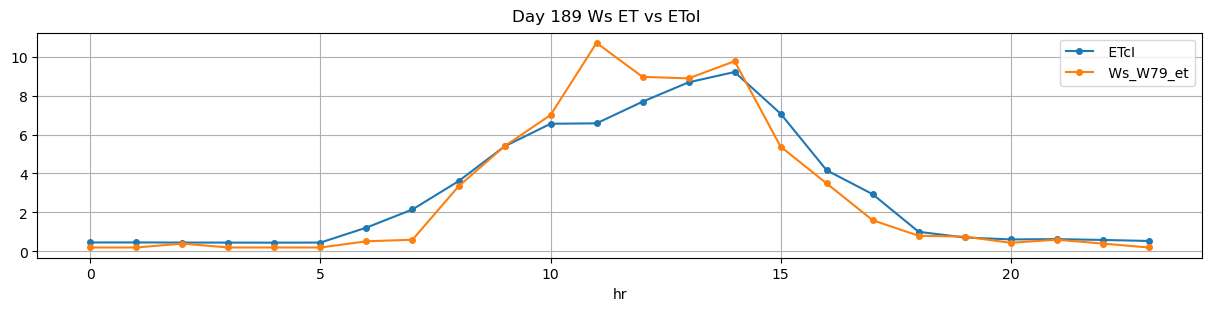
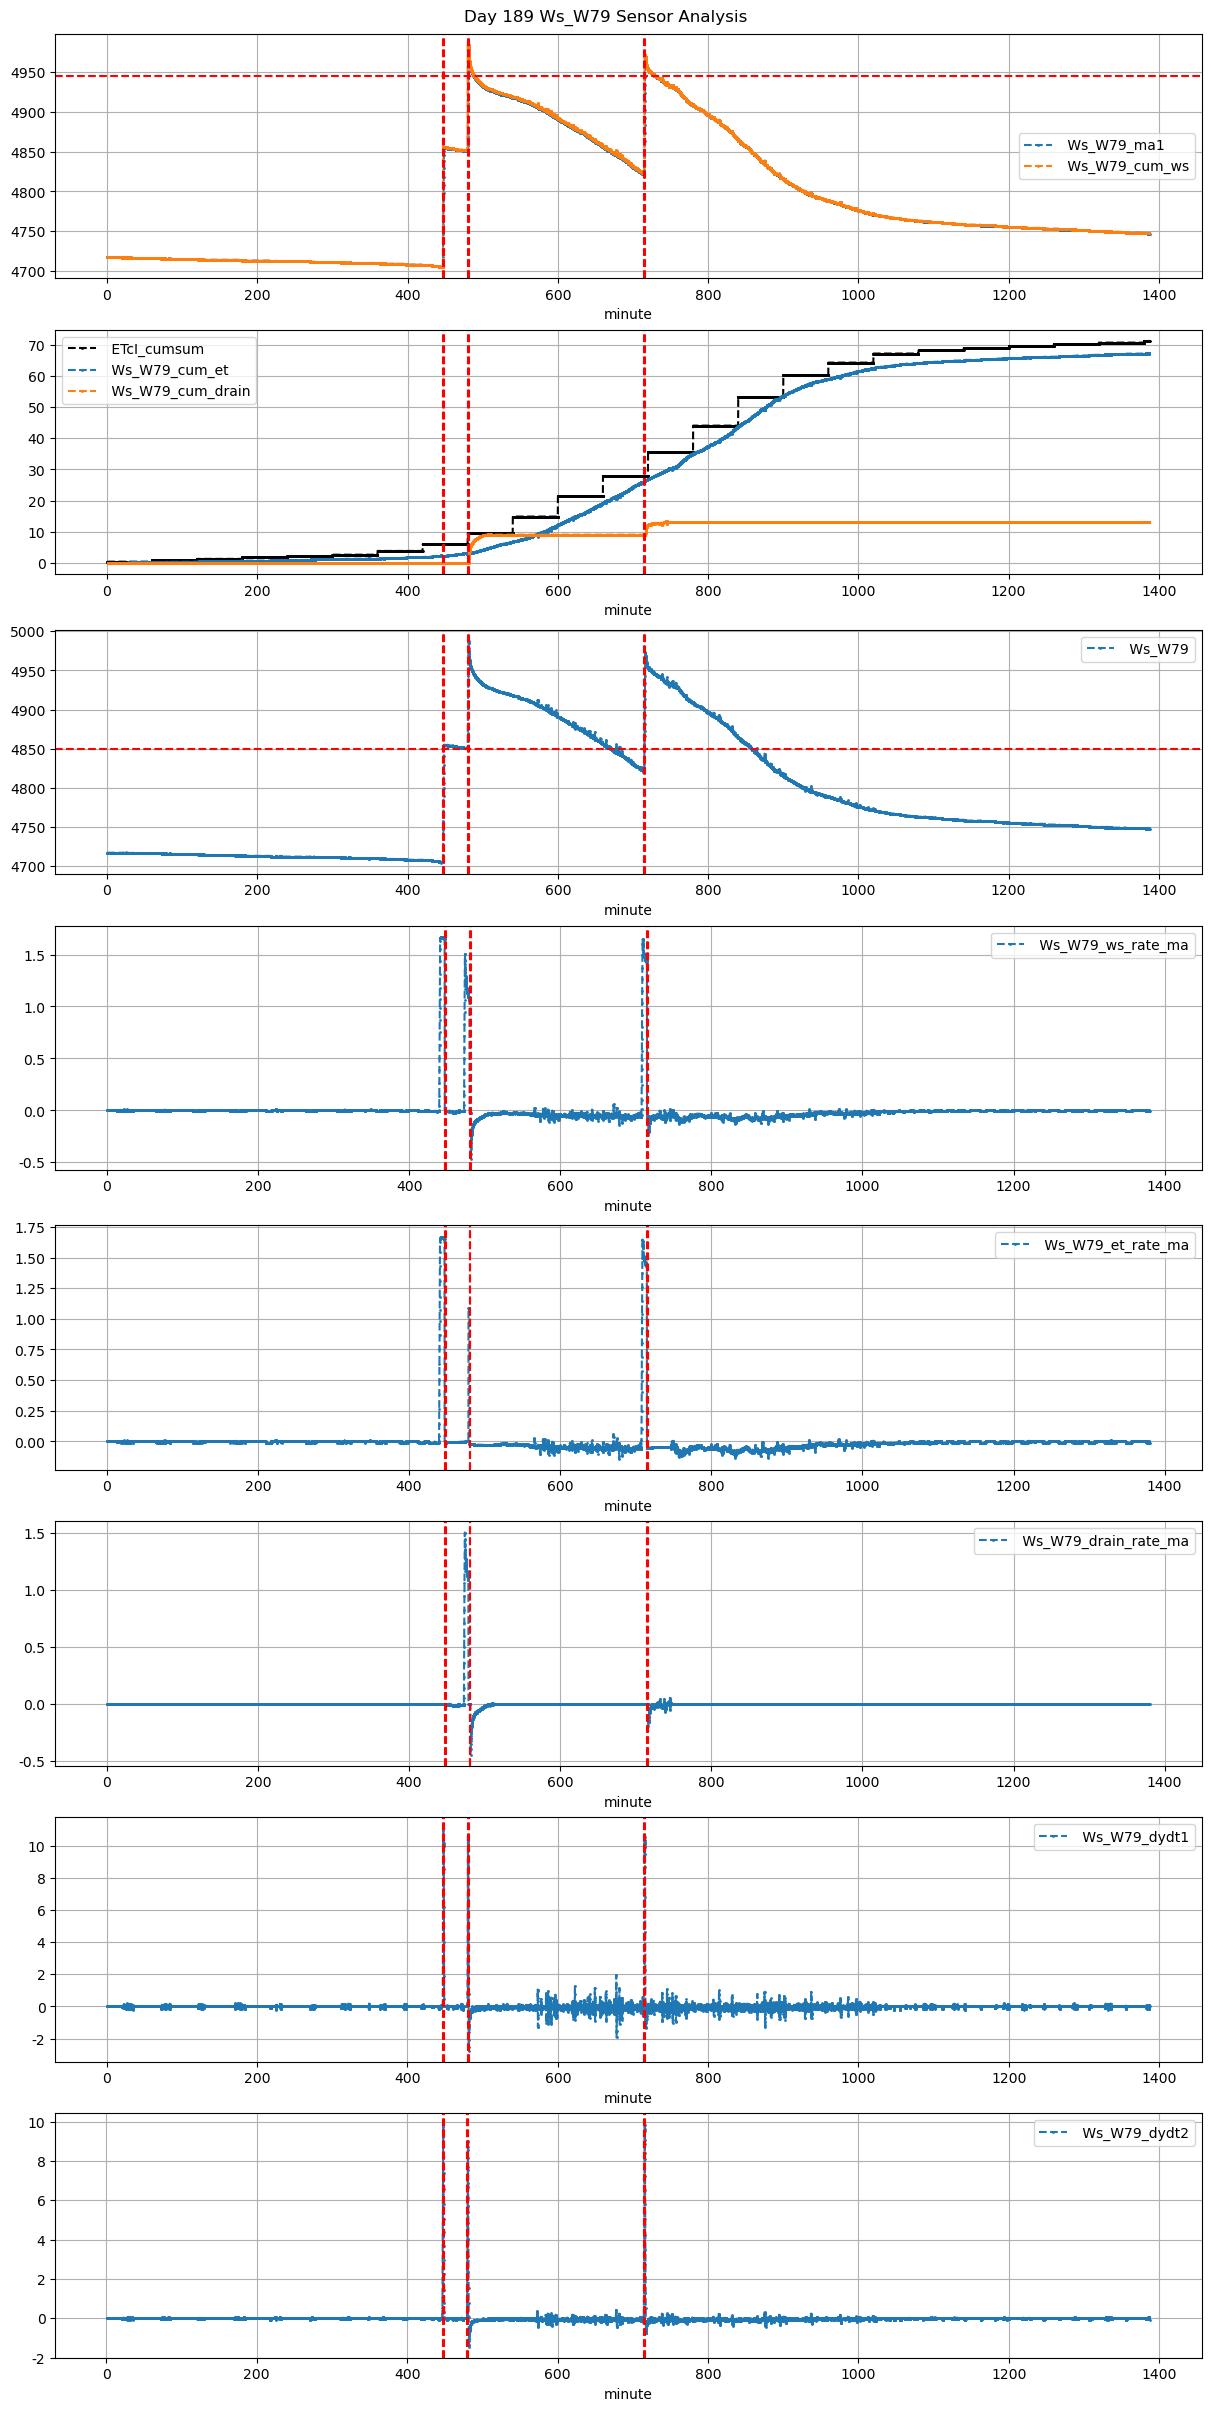
189 |
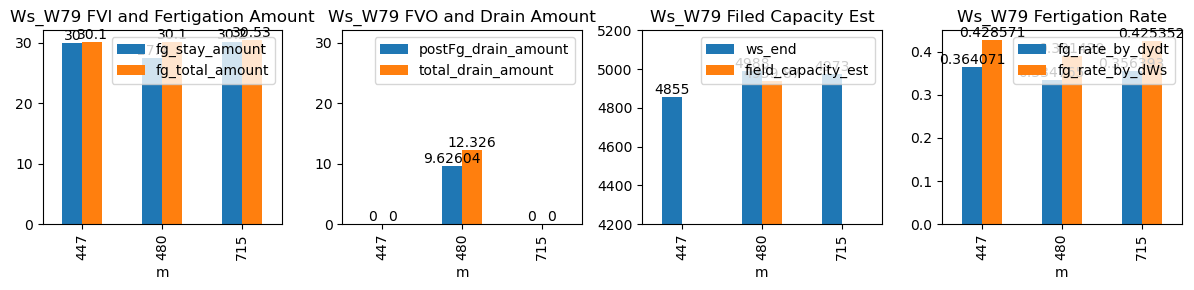
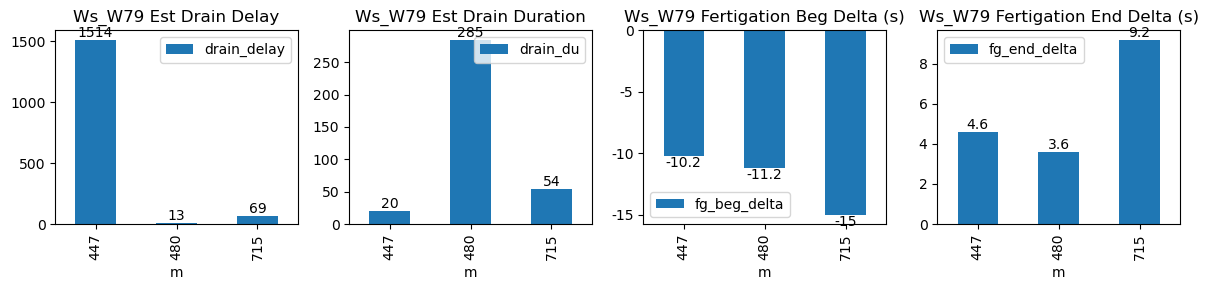
447 |
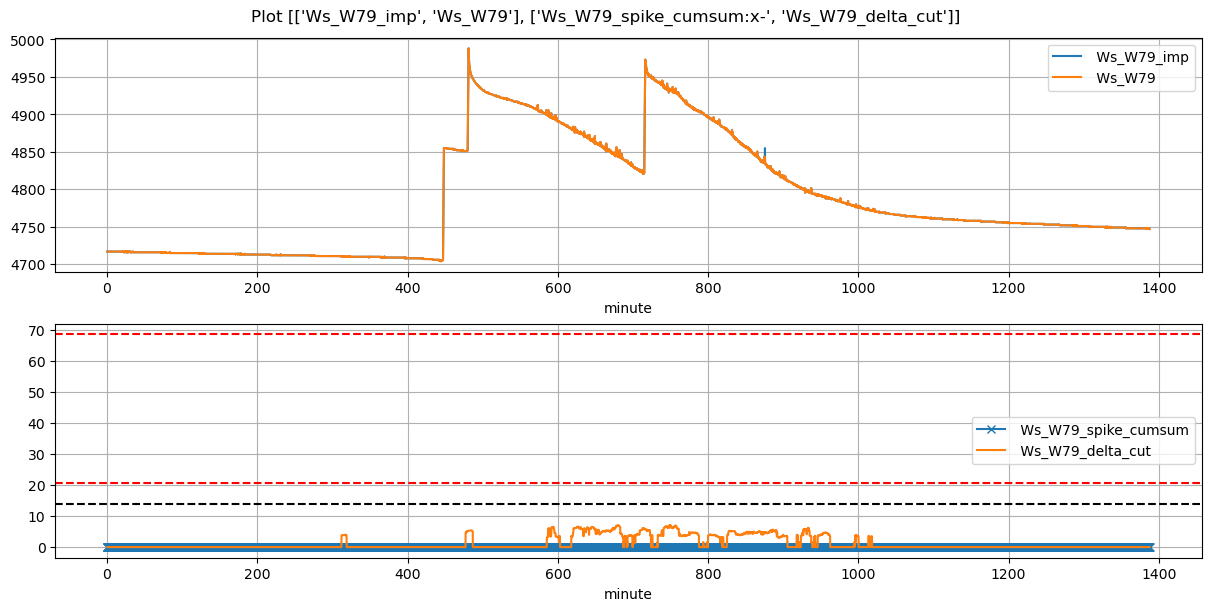
Ws_W79 |
0.360032 |
30 |
447.17 |
447.000000 |
448.34 |
448.416667 |
4705.0 |
4855.0 |
70 |
-0.015121 |
-0.014537 |
0.000000 |
0.364071 |
0.428571 |
30.0 |
True |
-10.2 |
4.6 |
30.10 |
0.0 |
0.000000 |
0.000000 |
20 |
1514 |
-0.197666 |
NaN |
| 2026-04-13 08:00:01+08:00 |
189 |
480 |
Ws_W79 |
0.360032 |
30 |
480.02 |
479.833333 |
481.19 |
481.250000 |
4851.0 |
4988.0 |
70 |
-0.010795 |
-0.239907 |
-0.031042 |
0.334765 |
0.391429 |
27.4 |
True |
-11.2 |
3.6 |
30.10 |
2.7 |
9.626039 |
12.326039 |
285 |
13 |
-1.785616 |
4939.869804 |
| 2026-04-13 11:55:00+08:00 |
189 |
715 |
Ws_W79 |
0.360032 |
30 |
715.00 |
714.750000 |
716.18 |
716.333333 |
4822.0 |
4973.0 |
71 |
-0.051248 |
-0.149375 |
-0.041620 |
0.356393 |
0.425352 |
30.2 |
True |
-15.0 |
9.2 |
30.53 |
0.0 |
0.000000 |
0.000000 |
54 |
69 |
-0.983904 |
NaN |