| 2026-03-11 08:00:00+08:00 |
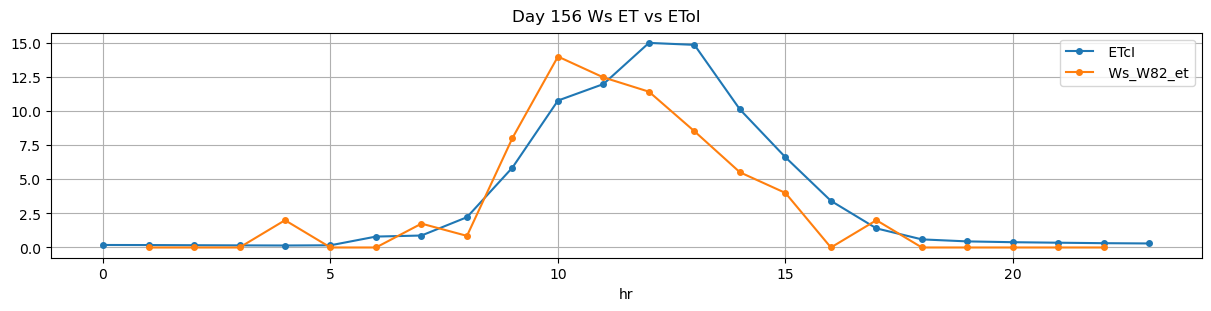
156 |
480 |
Ws_W82 |
1.884528 |
29.083333 |
480.00 |
480.000000 |
480.67 |
480.916667 |
3760.0 |
3860.000000 |
40 |
0.000000 |
-0.098765 |
0.000000 |
0.398500 |
0.500000 |
20.000000 |
True |
0.0 |
14.8 |
20.000 |
0.0 |
1.975000 |
1.975000 |
409 |
29 |
-0.111111 |
3850.125000 |
| 2026-03-11 08:30:42+08:00 |
156 |
510 |
Ws_W82 |
1.884528 |
30.000000 |
510.70 |
510.250000 |
511.90 |
512.083333 |
3850.0 |
4000.000000 |
72 |
-0.040704 |
-0.092593 |
-0.004850 |
0.391875 |
0.416667 |
30.000000 |
True |
-27.0 |
11.0 |
30.096 |
0.1 |
3.308578 |
3.408578 |
290 |
30 |
-0.181822 |
3983.457111 |
| 2026-03-11 11:30:01+08:00 |
156 |
690 |
Ws_W82 |
1.884528 |
30.000000 |
690.02 |
689.916667 |
691.24 |
691.416667 |
3830.0 |
3987.250000 |
73 |
-0.092482 |
-0.165226 |
-0.129012 |
0.431250 |
0.430822 |
31.450000 |
True |
-6.2 |
10.6 |
31.450 |
0.0 |
2.516567 |
2.516567 |
770 |
15 |
-0.128748 |
3974.667165 |
| 2026-03-11 12:45:01+08:00 |
156 |
765 |
Ws_W82 |
1.884528 |
30.000000 |
765.02 |
765.000000 |
766.20 |
766.416667 |
3890.0 |
4037.500000 |
71 |
-0.061741 |
-0.140675 |
-0.116512 |
0.421080 |
0.415493 |
29.500000 |
True |
-1.2 |
13.0 |
29.678 |
0.2 |
3.353819 |
3.553819 |
414 |
17 |
-0.158017 |
4020.730907 |
| 2026-03-11 13:45:01+08:00 |
156 |
825 |
Ws_W82 |
1.884528 |
30.000000 |
825.02 |
824.500000 |
826.20 |
826.333333 |
3970.0 |
4112.222222 |
71 |
-0.042050 |
-0.098148 |
-0.037346 |
0.372727 |
0.400626 |
28.444444 |
True |
-31.2 |
8.0 |
29.678 |
1.2 |
3.440492 |
4.640492 |
365 |
12 |
-0.072768 |
4095.019762 |