| 2026-03-12 08:01:17+08:00 |
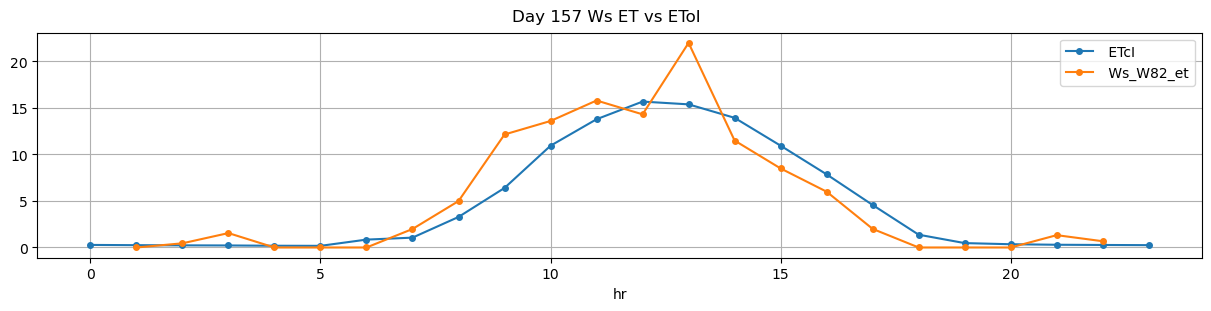
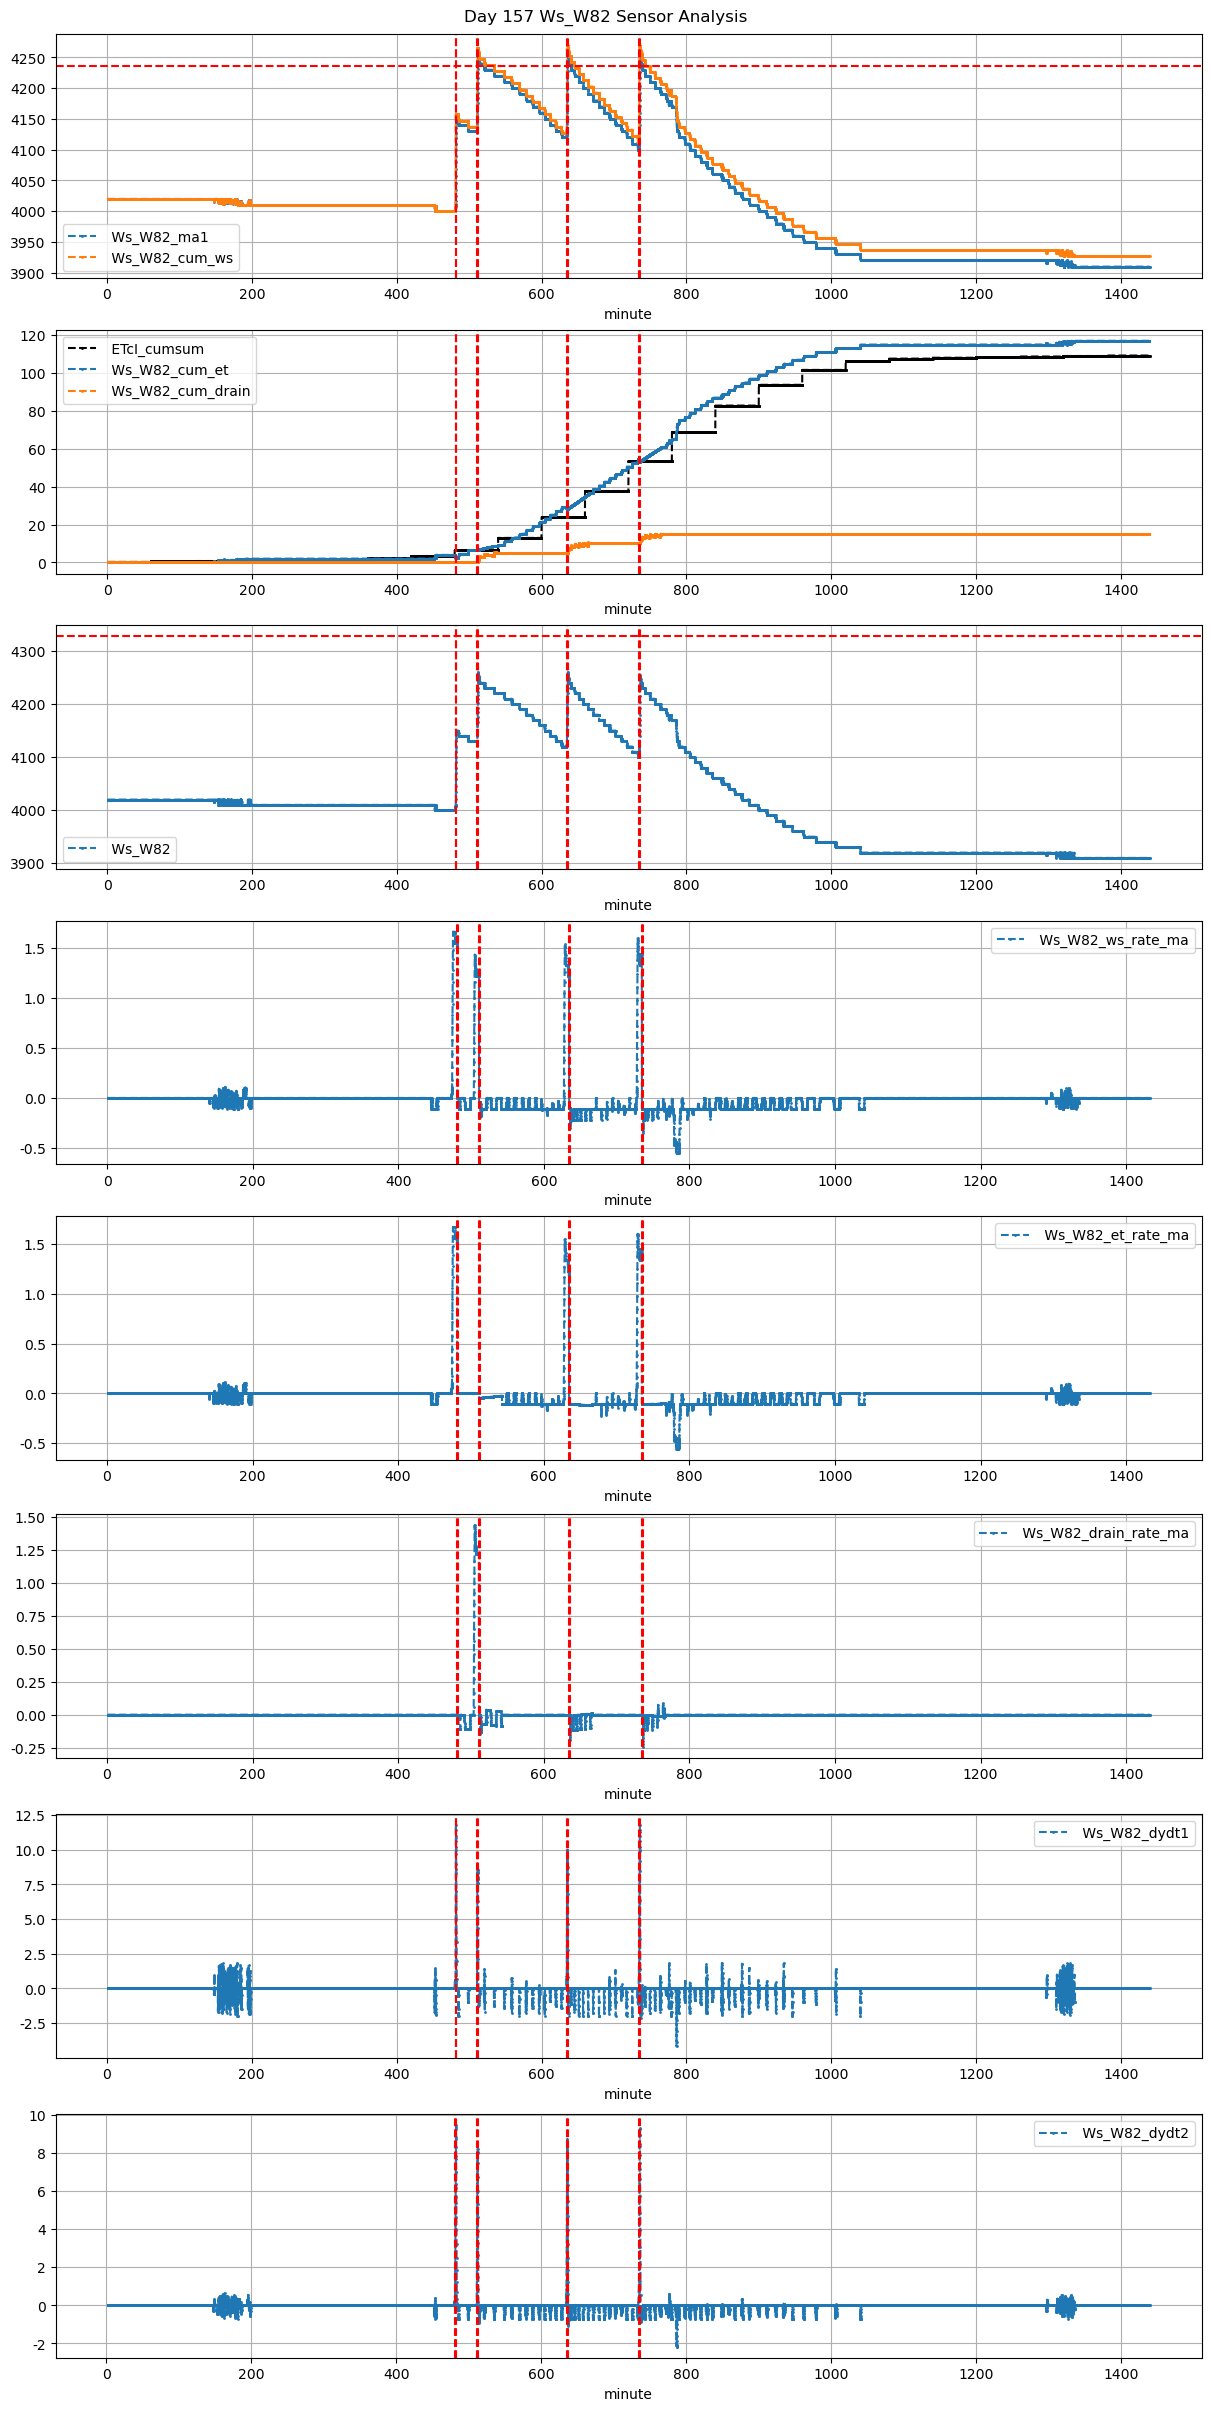
157 |
481 |
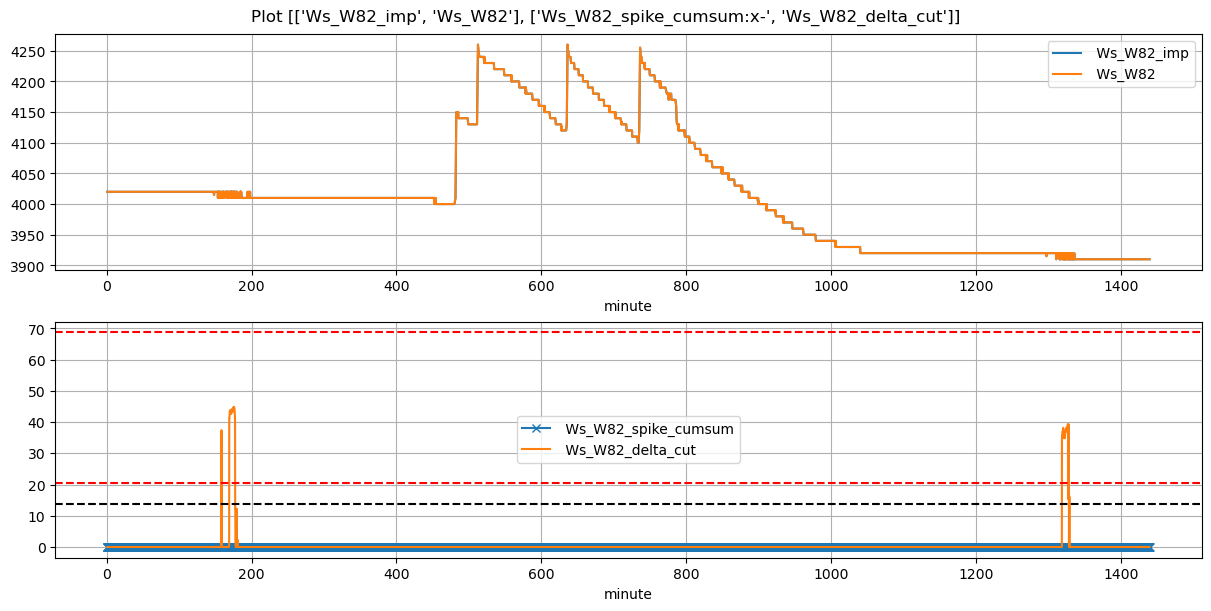
Ws_W82 |
1.386148 |
28.166667 |
481.28 |
481.166667 |
482.46 |
482.833333 |
4000.000000 |
4150.000000 |
71 |
0.000000 |
-0.038272 |
0.000000 |
0.348571 |
0.422535 |
30.000000 |
True |
-6.8 |
22.4 |
30.000000 |
0.000000 |
0.000000 |
0.000000 |
145 |
37 |
-0.111111 |
NaN |
| 2026-03-12 08:31:15+08:00 |
157 |
511 |
Ws_W82 |
1.386148 |
30.000000 |
511.25 |
511.000000 |
512.42 |
512.666667 |
4130.000000 |
4257.500000 |
70 |
-0.044472 |
-0.121682 |
-0.022840 |
0.297704 |
0.364286 |
25.500000 |
True |
-15.0 |
14.8 |
29.376667 |
2.049785 |
4.099571 |
6.149356 |
489 |
19 |
-0.120585 |
4237.002146 |
| 2026-03-12 10:35:00+08:00 |
157 |
635 |
Ws_W82 |
1.386148 |
30.000000 |
635.00 |
634.750000 |
636.23 |
636.333333 |
4120.000000 |
4256.100000 |
74 |
-0.104899 |
-0.170370 |
-0.120370 |
0.321000 |
0.367838 |
27.220000 |
True |
-15.0 |
6.2 |
31.055333 |
2.038343 |
4.076687 |
6.115030 |
720 |
11 |
-0.116881 |
4235.716567 |
| 2026-03-12 12:15:00+08:00 |
157 |
735 |
Ws_W82 |
1.386148 |
30.000000 |
735.00 |
734.666667 |
736.17 |
736.416667 |
4103.704545 |
4251.428571 |
70 |
-0.108586 |
-0.161728 |
-0.099691 |
0.337852 |
0.422069 |
29.544805 |
True |
-20.0 |
14.8 |
29.544805 |
0.000000 |
3.978801 |
3.978801 |
1194 |
19 |
-0.113981 |
4231.534567 |