| 2026-03-13 08:01:12+08:00 |
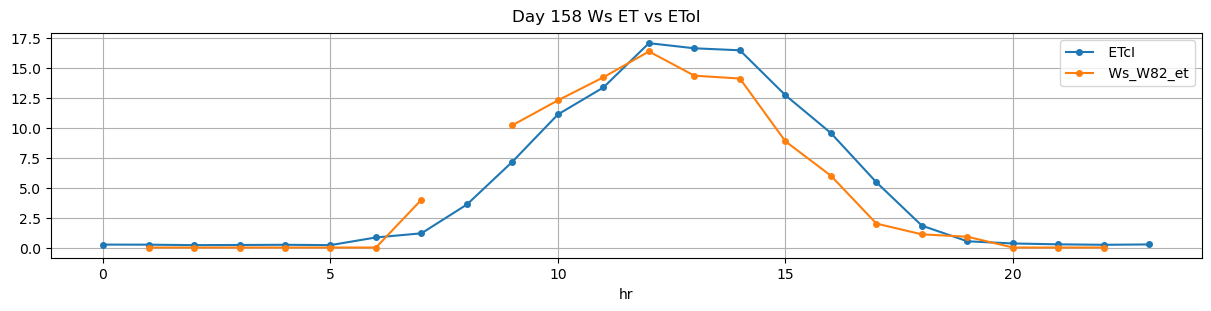
158 |
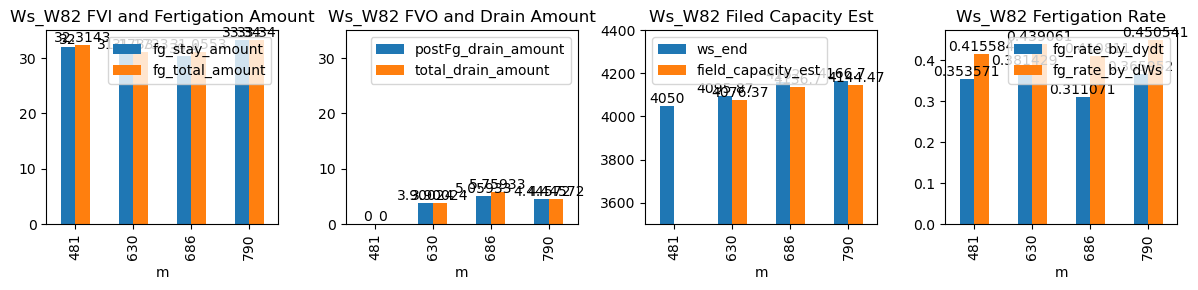
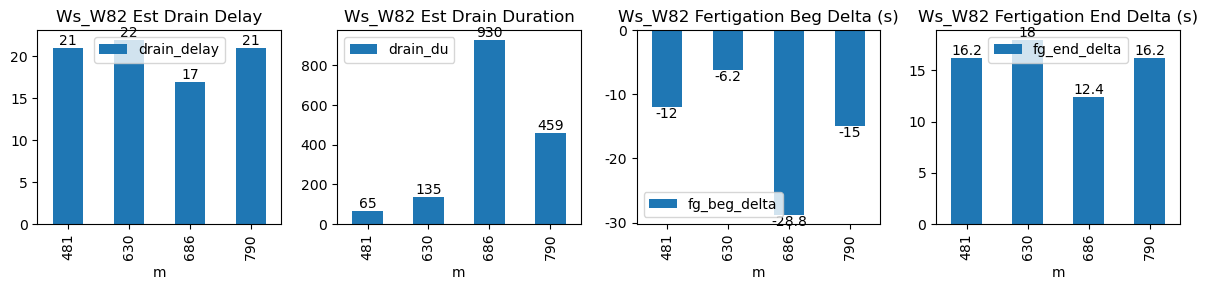
481 |
Ws_W82 |
0.987344 |
30 |
481.20 |
481.000000 |
482.48 |
482.750000 |
3890.0 |
4050.000000 |
77 |
-0.088149 |
-0.01358 |
-0.026543 |
0.353571 |
0.415584 |
32.000000 |
True |
-12.0 |
16.2 |
32.314333 |
0.0 |
0.000000 |
0.000000 |
65 |
21 |
-0.095709 |
NaN |
| 2026-03-13 10:30:01+08:00 |
158 |
630 |
Ws_W82 |
0.987344 |
30 |
630.02 |
629.916667 |
631.20 |
631.500000 |
3940.0 |
4095.866667 |
71 |
-0.078527 |
-0.14393 |
-0.108025 |
0.381429 |
0.439061 |
31.173333 |
True |
-6.2 |
18.0 |
31.173333 |
0.0 |
3.900244 |
3.900244 |
135 |
22 |
-0.129008 |
4076.365445 |
| 2026-03-13 11:26:14+08:00 |
158 |
686 |
Ws_W82 |
0.987344 |
30 |
686.23 |
685.750000 |
687.46 |
687.666667 |
4010.0 |
4162.000000 |
74 |
-0.101228 |
-0.17037 |
-0.095473 |
0.311071 |
0.410811 |
30.400000 |
True |
-28.8 |
12.4 |
31.055333 |
0.7 |
5.059327 |
5.759327 |
930 |
17 |
-0.121205 |
4136.703366 |
| 2026-03-13 13:10:00+08:00 |
158 |
790 |
Ws_W82 |
0.987344 |
30 |
790.00 |
789.750000 |
791.23 |
791.500000 |
4000.0 |
4166.700000 |
74 |
-0.110591 |
-0.17572 |
-0.108109 |
0.365952 |
0.450541 |
33.340000 |
True |
-15.0 |
16.2 |
33.340000 |
0.0 |
4.445719 |
4.445719 |
459 |
21 |
-0.111874 |
4144.471403 |