| 2026-04-11 07:22:13+08:00 |
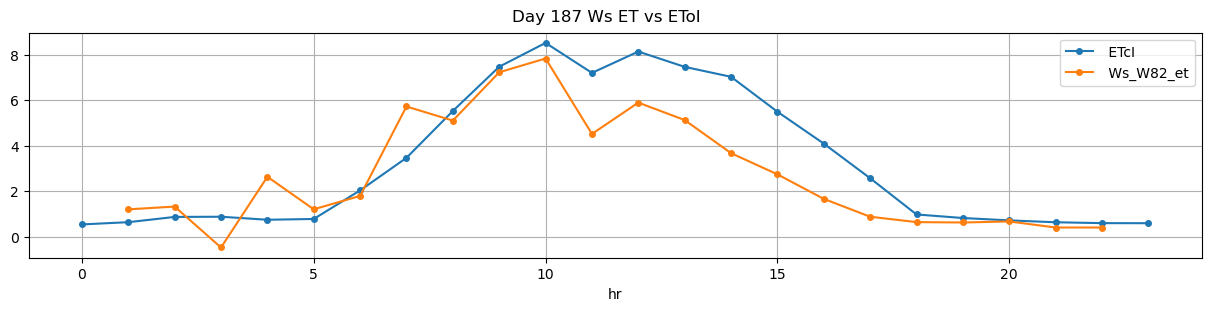
187 |
442 |
Ws_W82 |
0.750586 |
30 |
442.22 |
442.166667 |
443.40 |
444.166667 |
5064.5 |
5265.333333 |
71 |
-0.024099 |
-0.036469 |
-0.044902 |
0.496583 |
0.565728 |
40.166667 |
True |
-3.2 |
46.0 |
40.166667 |
0.000000 |
0.000000 |
0.000000 |
4 |
51 |
-0.098207 |
NaN |
| 2026-04-11 08:20:01+08:00 |
187 |
500 |
Ws_W82 |
0.750586 |
30 |
500.02 |
500.000000 |
501.20 |
501.416667 |
5230.6 |
5405.625000 |
71 |
-0.033900 |
-0.052479 |
-0.033138 |
0.487729 |
0.493028 |
35.005000 |
True |
-1.2 |
13.0 |
36.494000 |
1.013787 |
2.027574 |
3.041362 |
190 |
18 |
-0.082885 |
5395.487128 |
| 2026-04-11 09:15:01+08:00 |
187 |
555 |
Ws_W82 |
0.750586 |
30 |
555.02 |
555.000000 |
556.20 |
556.416667 |
5366.0 |
5533.145833 |
71 |
-0.066459 |
-0.140746 |
0.000000 |
0.435667 |
0.470833 |
33.429167 |
True |
-1.2 |
13.0 |
36.494000 |
3.100000 |
7.802693 |
10.902693 |
219 |
17 |
-0.111646 |
5494.132369 |
| 2026-04-11 09:50:01+08:00 |
187 |
590 |
Ws_W82 |
0.750586 |
30 |
590.02 |
590.000000 |
591.22 |
591.333333 |
5464.0 |
5611.729167 |
72 |
-0.059193 |
-0.127521 |
-0.054470 |
0.443104 |
0.410359 |
29.545833 |
True |
-1.2 |
6.8 |
37.008000 |
4.455209 |
8.910419 |
13.365628 |
185 |
11 |
-0.197647 |
5567.177073 |
| 2026-04-11 11:05:01+08:00 |
187 |
665 |
Ws_W82 |
0.750586 |
30 |
665.02 |
664.916667 |
665.70 |
665.916667 |
5518.0 |
5625.916667 |
41 |
-0.056963 |
-0.093261 |
-0.029969 |
0.410490 |
0.526423 |
21.583333 |
True |
-6.2 |
13.0 |
21.583333 |
0.000000 |
6.007272 |
6.007272 |
230 |
17 |
-0.067968 |
5595.880308 |