VI and VO Daily Summary
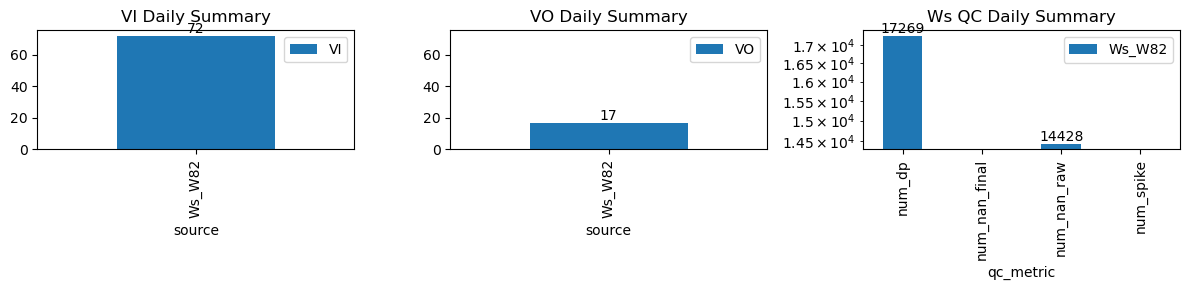
| ws_name | num_dp | num_nan_raw | num_nan_final | num_spike | cum_step_adj |
|---|---|---|---|---|---|
| Ws_W82 | 17,269 | 14,428 | 0 | 0 | 0.00 |
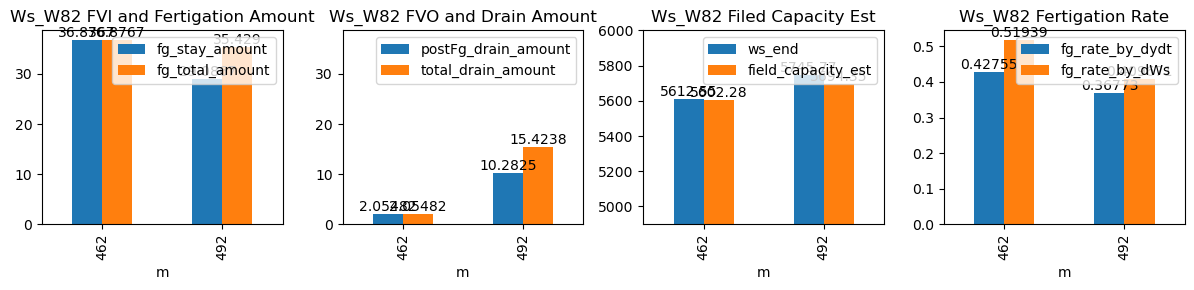
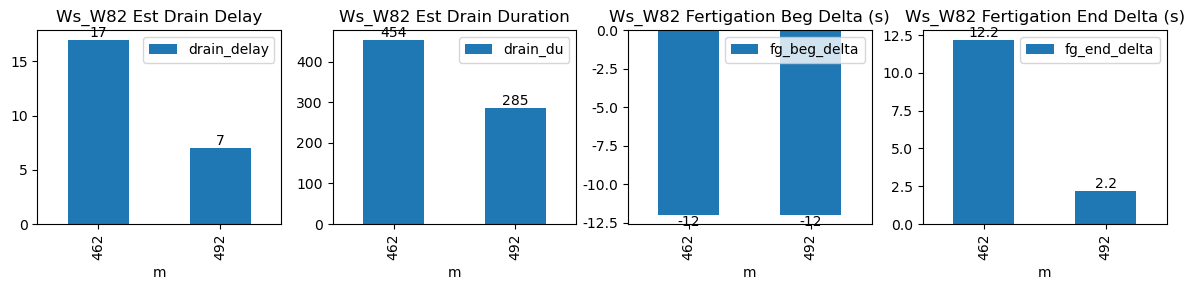
| ds | d | m | ws_name | prominence_cut | max_drain_du | fg_beg | fg_beg_est | fg_end | fg_end_est | ws_beg | ws_end | duc | pre_fg_et | post_fg_ws | post_drn_et | fg_rate_by_dydt | fg_rate_by_dWs | fg_stay_amount | enough_data | fg_beg_delta | fg_end_delta | fg_total_amount | fg_drain_amount | postFg_drain_amount | total_drain_amount | drain_du | drain_delay | drain_rate | field_capacity_est |
|---|---|---|---|---|---|---|---|---|---|---|---|---|---|---|---|---|---|---|---|---|---|---|---|---|---|---|---|---|---|
| 2026-04-12 07:42:12+08:00 | 188 | 462 | Ws_W82 | 0.357081 | 28.416667 | 462.2 | 462.0 | 463.38 | 463.583333 | 5428.166667 | 5612.550000 | 71 | -0.001270 | -0.022037 | 0.00000 | 0.42755 | 0.519390 | 36.876667 | True | -12.0 | 12.2 | 36.876667 | 0.000000 | 2.054823 | 2.054823 | 454 | 17 | -0.021990 | 5602.275883 |
| 2026-04-12 08:12:12+08:00 | 188 | 492 | Ws_W82 | 0.357081 | 30.000000 | 492.2 | 492.0 | 493.38 | 493.416667 | 5600.333333 | 5745.766667 | 71 | -0.019037 | -0.089465 | -0.01374 | 0.36773 | 0.409671 | 29.086667 | True | -12.0 | 2.2 | 35.429000 | 5.141271 | 10.282541 | 15.423812 | 285 | 7 | -0.183335 | 5694.353960 |