| 2026-04-13 07:45:01+08:00 |
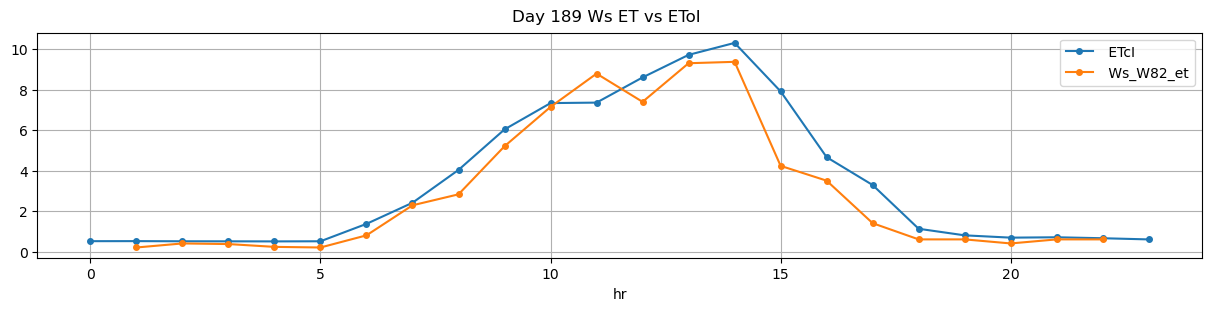
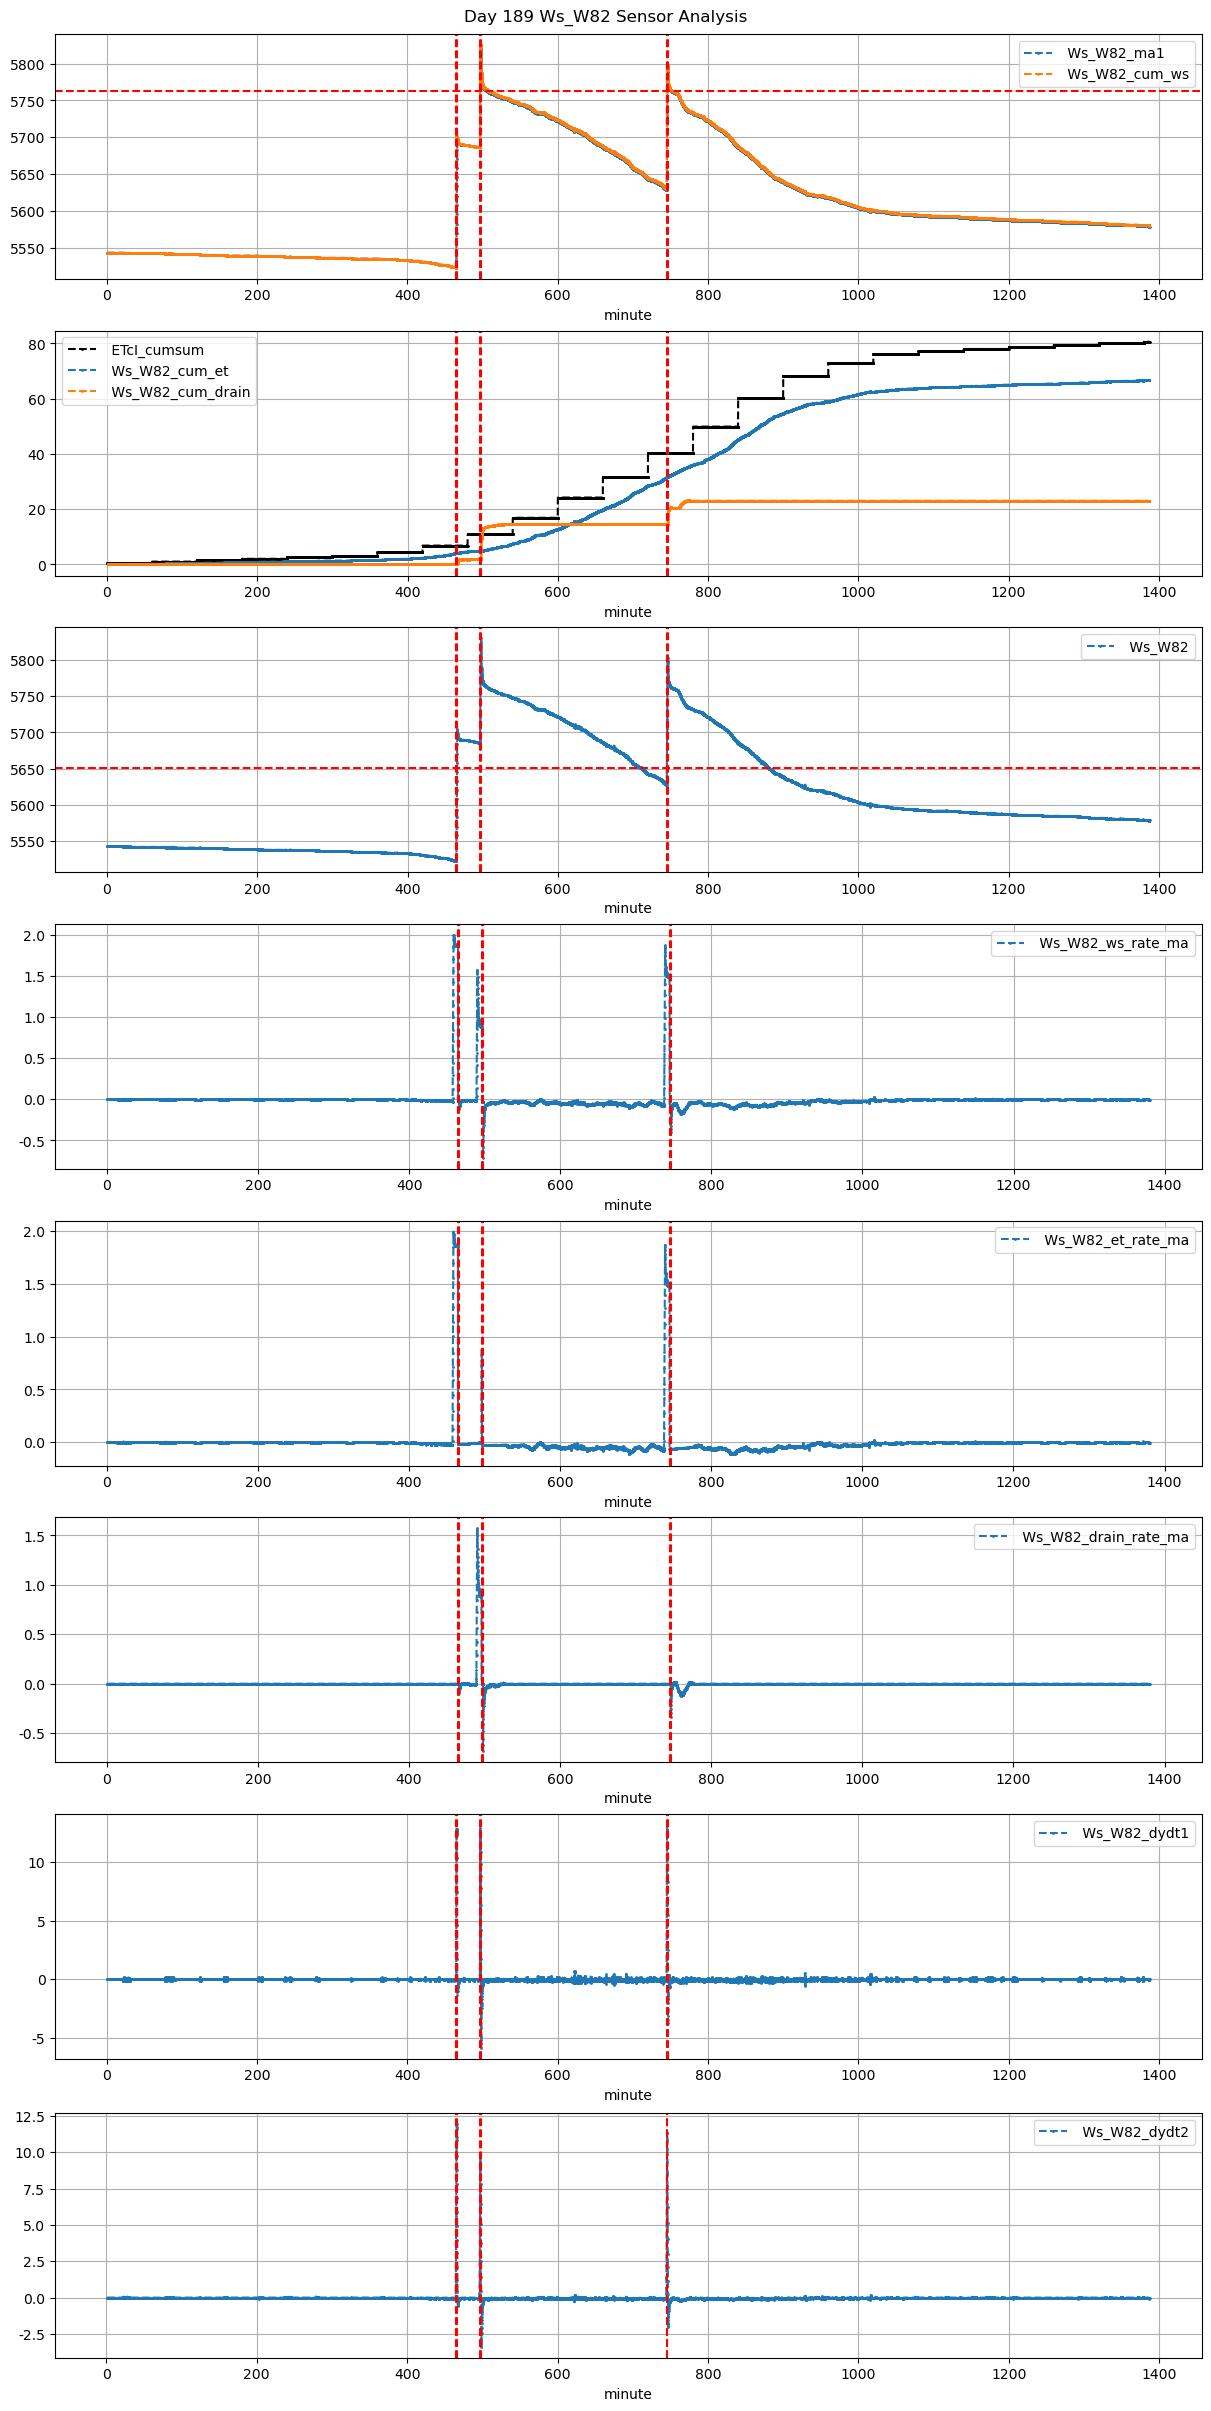
189 |
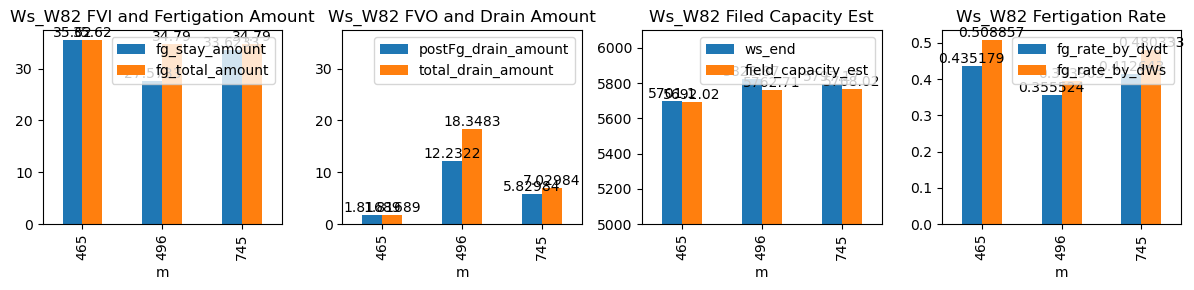
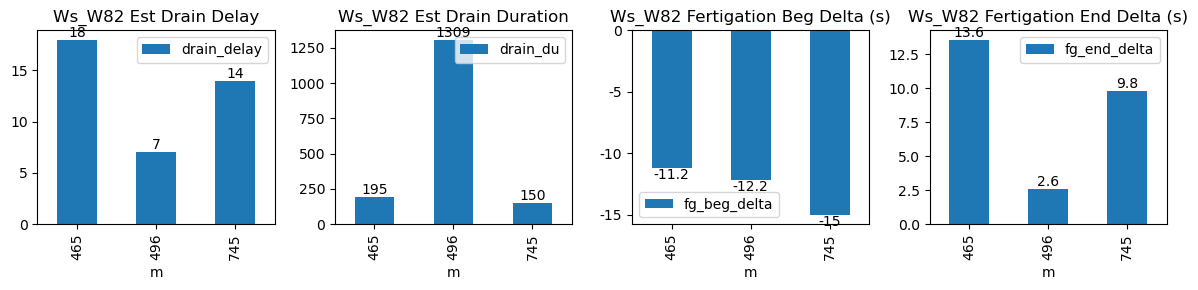
465 |
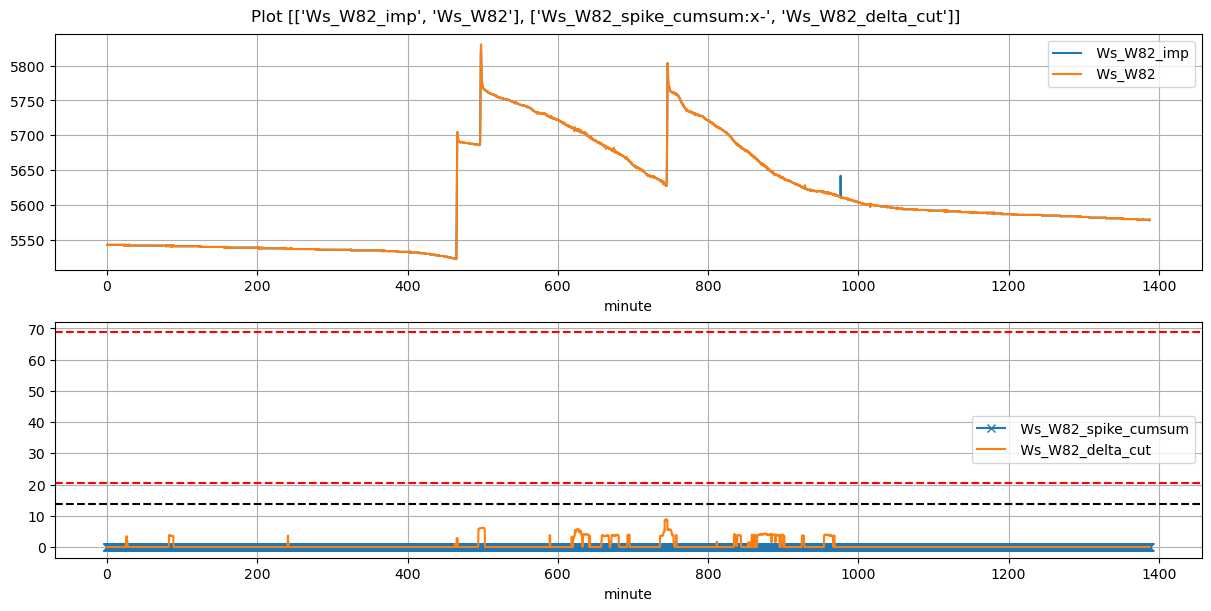
Ws_W82 |
0.606223 |
29.583333 |
465.02 |
464.833333 |
466.19 |
466.416667 |
5523.00 |
5701.100000 |
70 |
-0.020979 |
-0.025000 |
0.000000 |
0.435179 |
0.508857 |
35.620000 |
True |
-11.2 |
13.6 |
35.62 |
0.000000 |
1.816887 |
1.816887 |
195 |
18 |
-0.032655 |
5692.015564 |
| 2026-04-13 08:16:37+08:00 |
189 |
496 |
Ws_W82 |
0.606223 |
30.000000 |
496.62 |
496.416667 |
497.79 |
497.833333 |
5686.00 |
5823.866667 |
70 |
-0.027996 |
-0.128385 |
-0.022234 |
0.355524 |
0.393905 |
27.573333 |
True |
-12.2 |
2.6 |
34.79 |
6.116086 |
12.232172 |
18.348258 |
1309 |
7 |
-0.133584 |
5762.705806 |
| 2026-04-13 12:25:00+08:00 |
189 |
745 |
Ws_W82 |
0.606223 |
30.000000 |
745.00 |
744.750000 |
746.17 |
746.333333 |
5629.05 |
5797.166667 |
70 |
-0.063742 |
-0.088481 |
-0.045509 |
0.412643 |
0.480333 |
33.623333 |
True |
-15.0 |
9.8 |
34.79 |
1.200000 |
5.829839 |
7.029839 |
150 |
14 |
-0.116566 |
5768.017471 |