| 2026-04-14 07:40:01+08:00 |
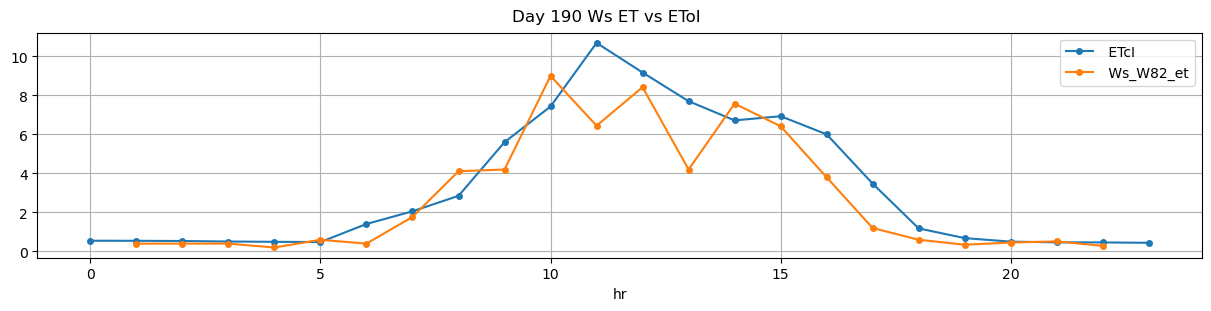
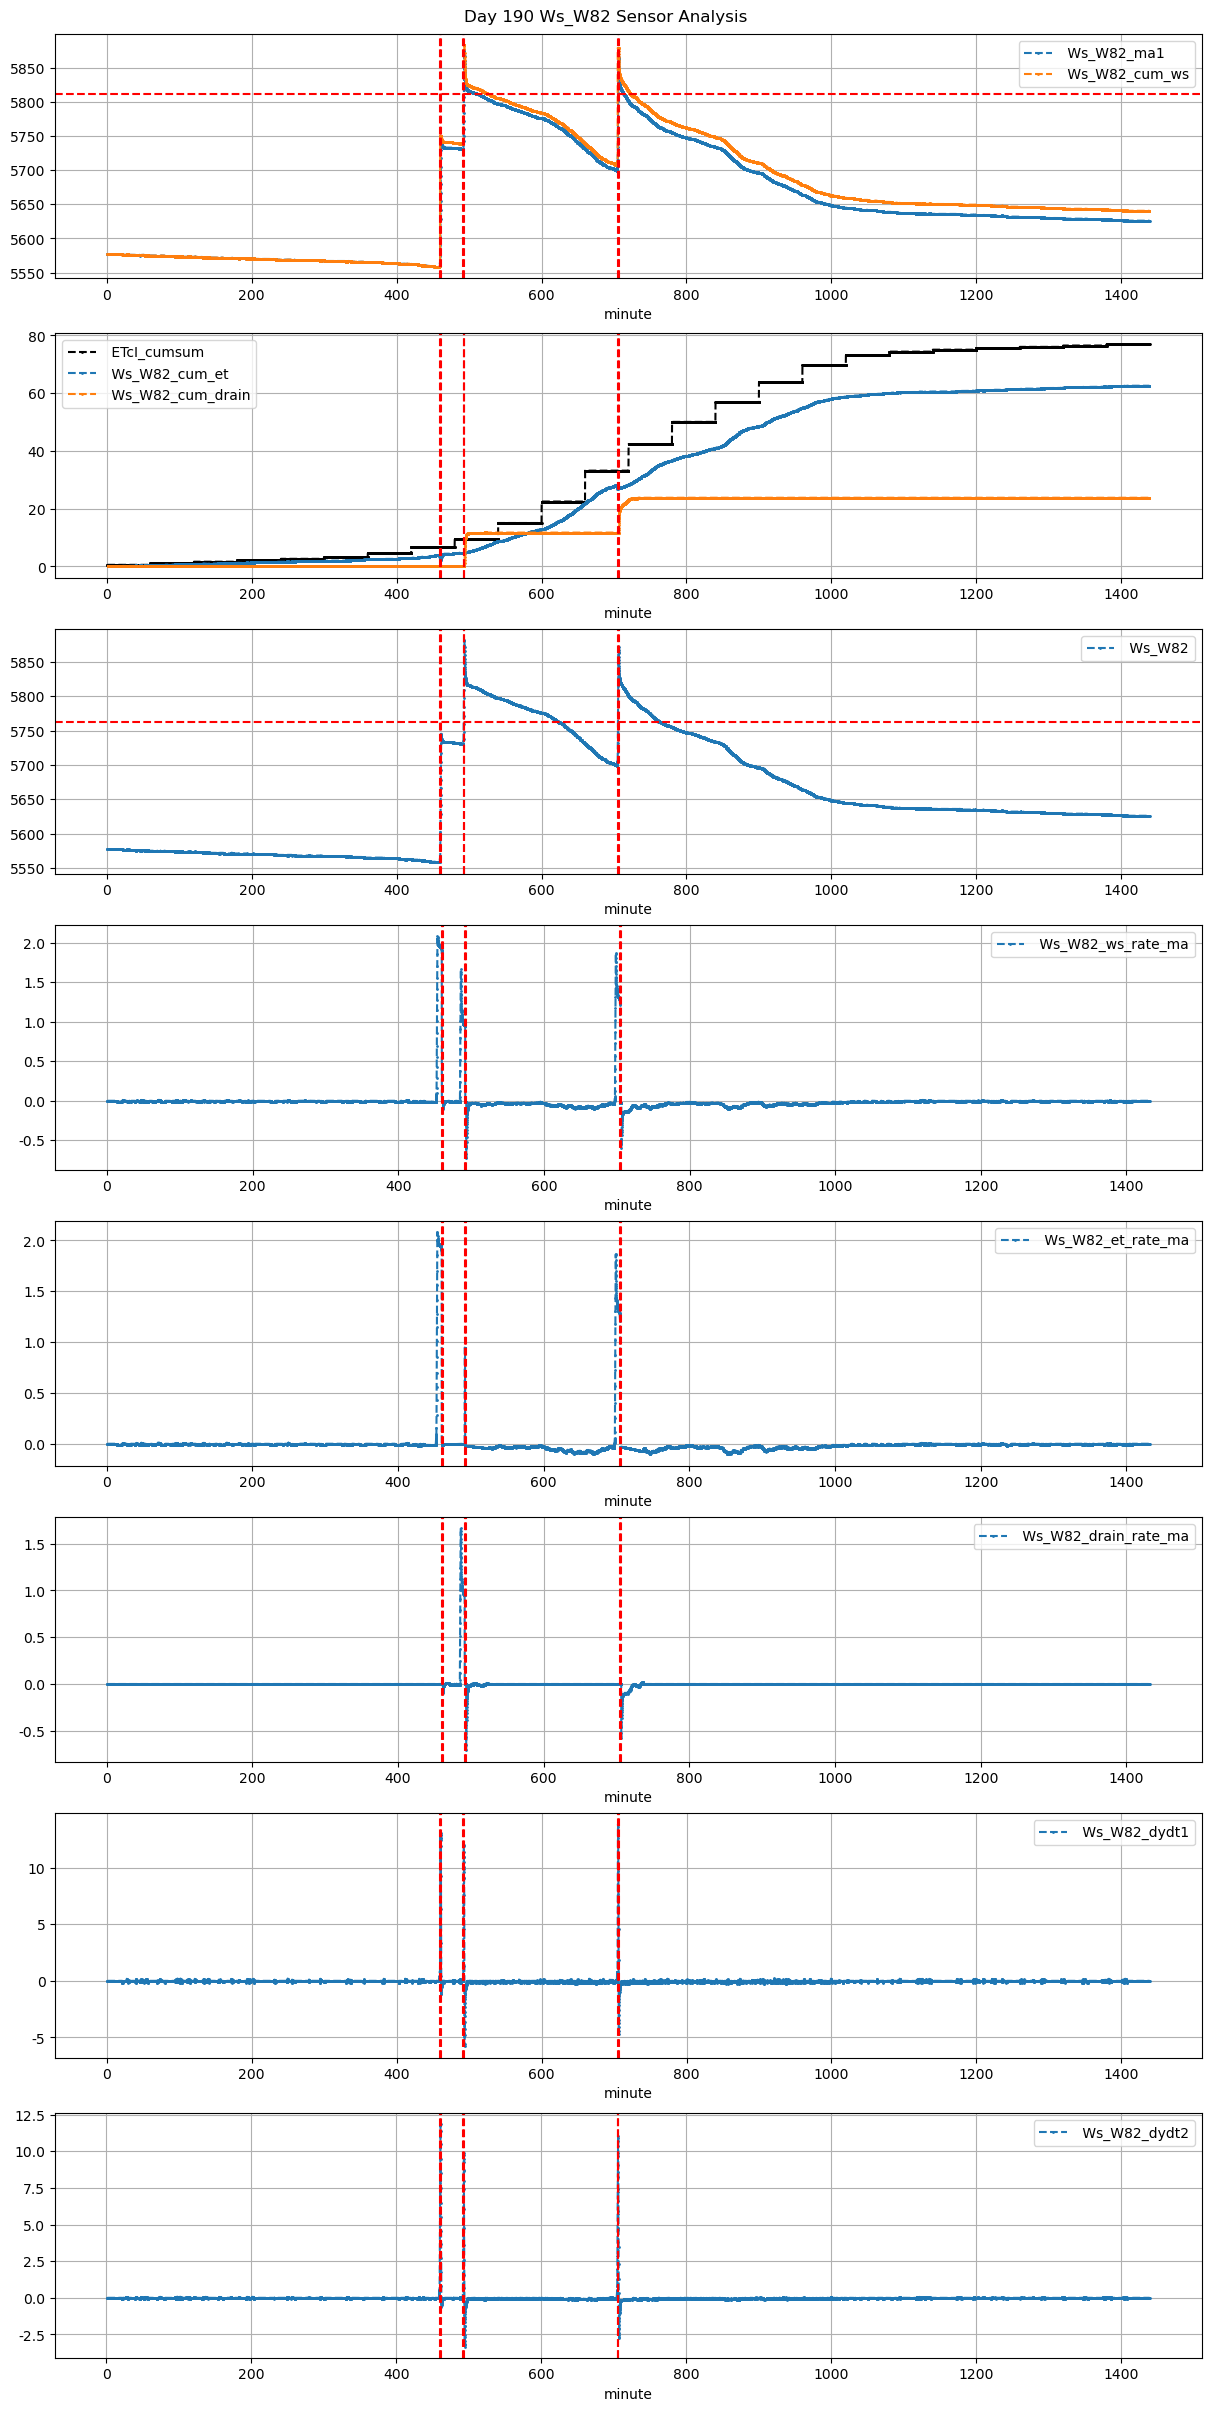
190 |
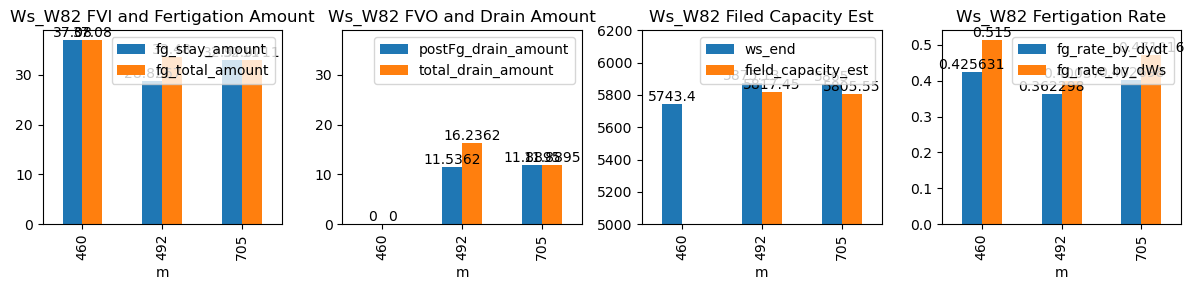
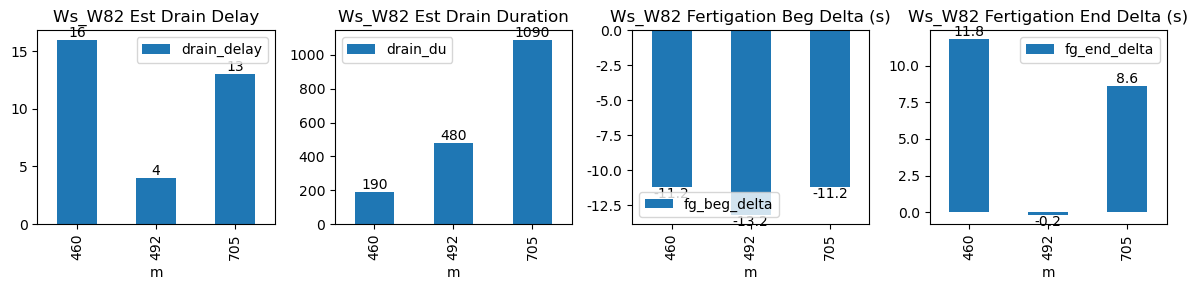
460 |
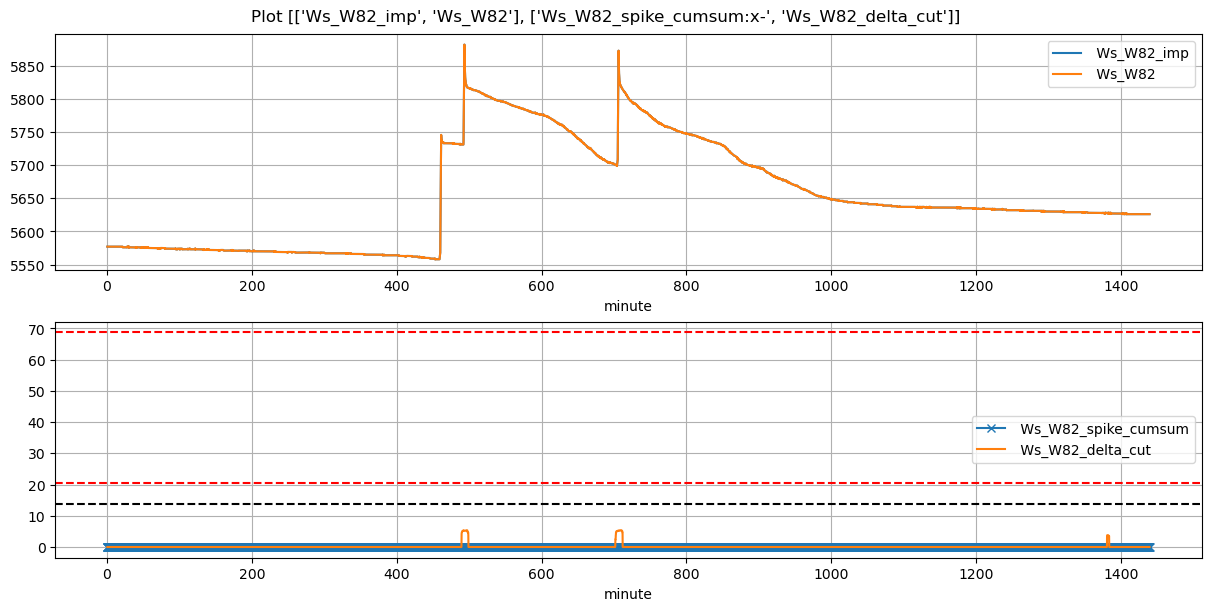
Ws_W82 |
0.653989 |
30 |
460.02 |
459.833333 |
461.22 |
461.416667 |
5558.000000 |
5743.400000 |
72 |
-0.007331 |
-0.014105 |
0.000000 |
0.425631 |
0.515000 |
37.080000 |
True |
-11.2 |
11.8 |
37.080000 |
0.0 |
0.000000 |
0.000000 |
190 |
16 |
-0.025890 |
NaN |
| 2026-04-14 08:12:13+08:00 |
190 |
492 |
Ws_W82 |
0.653989 |
30 |
492.22 |
492.000000 |
493.42 |
493.416667 |
5731.000000 |
5875.133333 |
72 |
-0.019798 |
-0.107233 |
-0.043689 |
0.362298 |
0.400370 |
28.826667 |
True |
-13.2 |
-0.2 |
33.480000 |
4.7 |
11.536174 |
16.236174 |
480 |
4 |
-0.138575 |
5817.452466 |
| 2026-04-14 11:45:01+08:00 |
190 |
705 |
Ws_W82 |
0.653989 |
30 |
705.02 |
704.833333 |
706.19 |
706.333333 |
5700.144444 |
5865.000000 |
70 |
-0.028277 |
-0.181790 |
-0.074321 |
0.402698 |
0.471016 |
32.971111 |
True |
-11.2 |
8.6 |
32.971111 |
0.0 |
11.889524 |
11.889524 |
1090 |
13 |
-0.150666 |
5805.552379 |