VI and VO Daily Summary
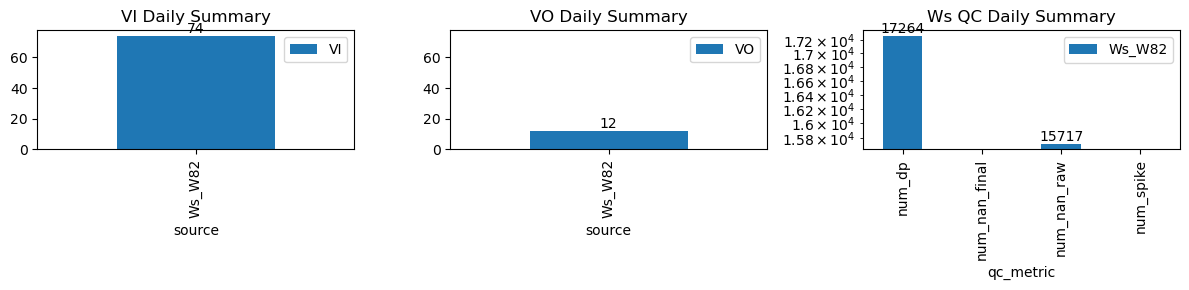
| ws_name | num_dp | num_nan_raw | num_nan_final | num_spike | cum_step_adj |
|---|---|---|---|---|---|
| Ws_W82 | 17,264 | 15,717 | 0 | 0 | 0.00 |
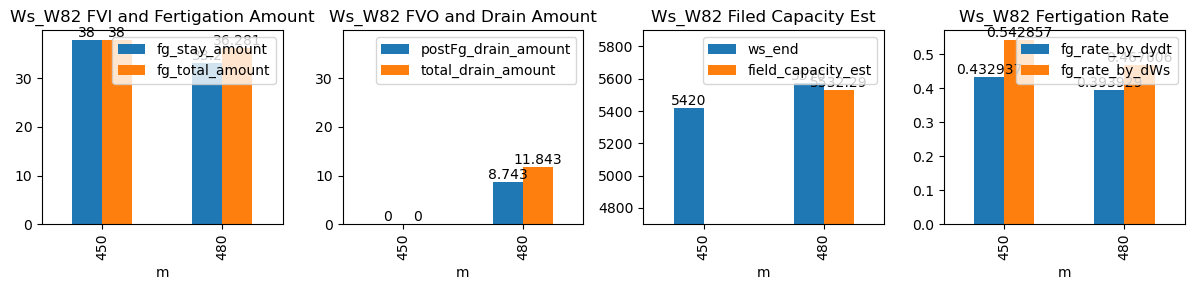
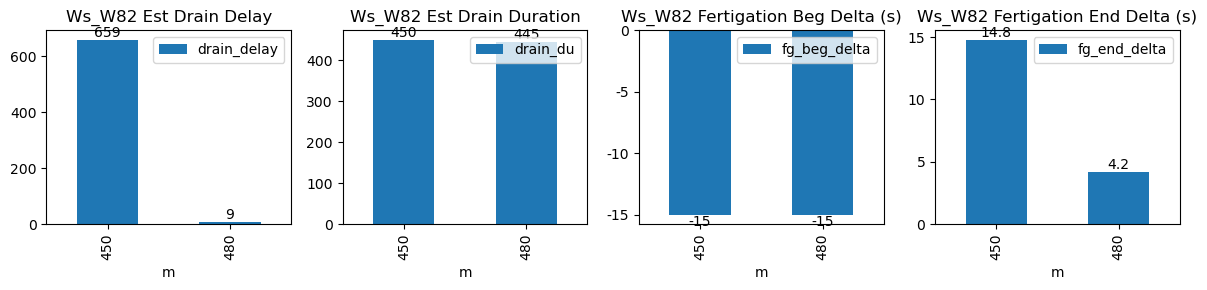
| ds | d | m | ws_name | prominence_cut | max_drain_du | fg_beg | fg_beg_est | fg_end | fg_end_est | ws_beg | ws_end | duc | pre_fg_et | post_fg_ws | post_drn_et | fg_rate_by_dydt | fg_rate_by_dWs | fg_stay_amount | enough_data | fg_beg_delta | fg_end_delta | fg_total_amount | fg_drain_amount | postFg_drain_amount | total_drain_amount | drain_du | drain_delay | drain_rate | field_capacity_est |
|---|---|---|---|---|---|---|---|---|---|---|---|---|---|---|---|---|---|---|---|---|---|---|---|---|---|---|---|---|---|
| 2026-04-03 07:30:00+08:00 | 179 | 450 | Ws_W82 | 1.476767 | 28.583333 | 450.0 | 449.75 | 451.17 | 451.416667 | 5230.0 | 5420.0 | 70 | 0.00000 | 0.00000 | 0.0 | 0.432937 | 0.542857 | 38.0 | True | -15.0 | 14.8 | 38.000 | 0.0 | 0.000 | 0.000 | 450 | 659 | -0.104687 | NaN |
| 2026-04-03 08:00:00+08:00 | 179 | 480 | Ws_W82 | 1.476767 | 30.000000 | 480.0 | 479.75 | 481.18 | 481.250000 | 5410.0 | 5576.0 | 71 | -0.01635 | -0.14321 | 0.0 | 0.393929 | 0.467606 | 33.2 | True | -15.0 | 4.2 | 36.281 | 3.1 | 8.743 | 11.843 | 445 | 9 | -0.283896 | 5532.285001 |