VI and VO Daily Summary
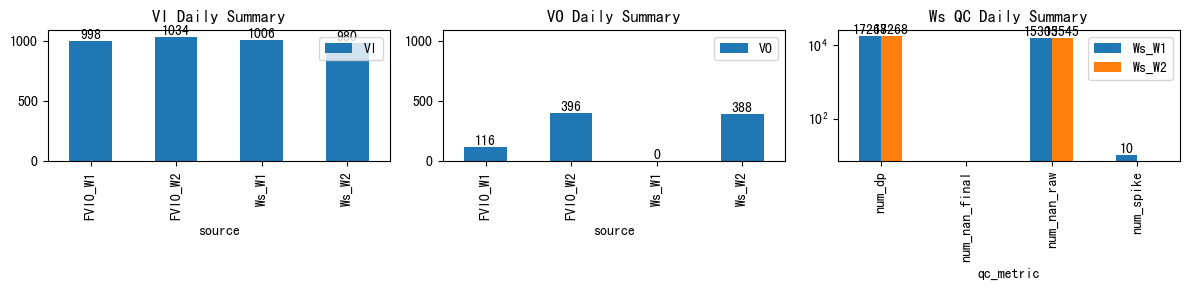
| ws_name | num_dp | num_nan_raw | num_nan_final | num_spike | cum_step_adj |
|---|---|---|---|---|---|
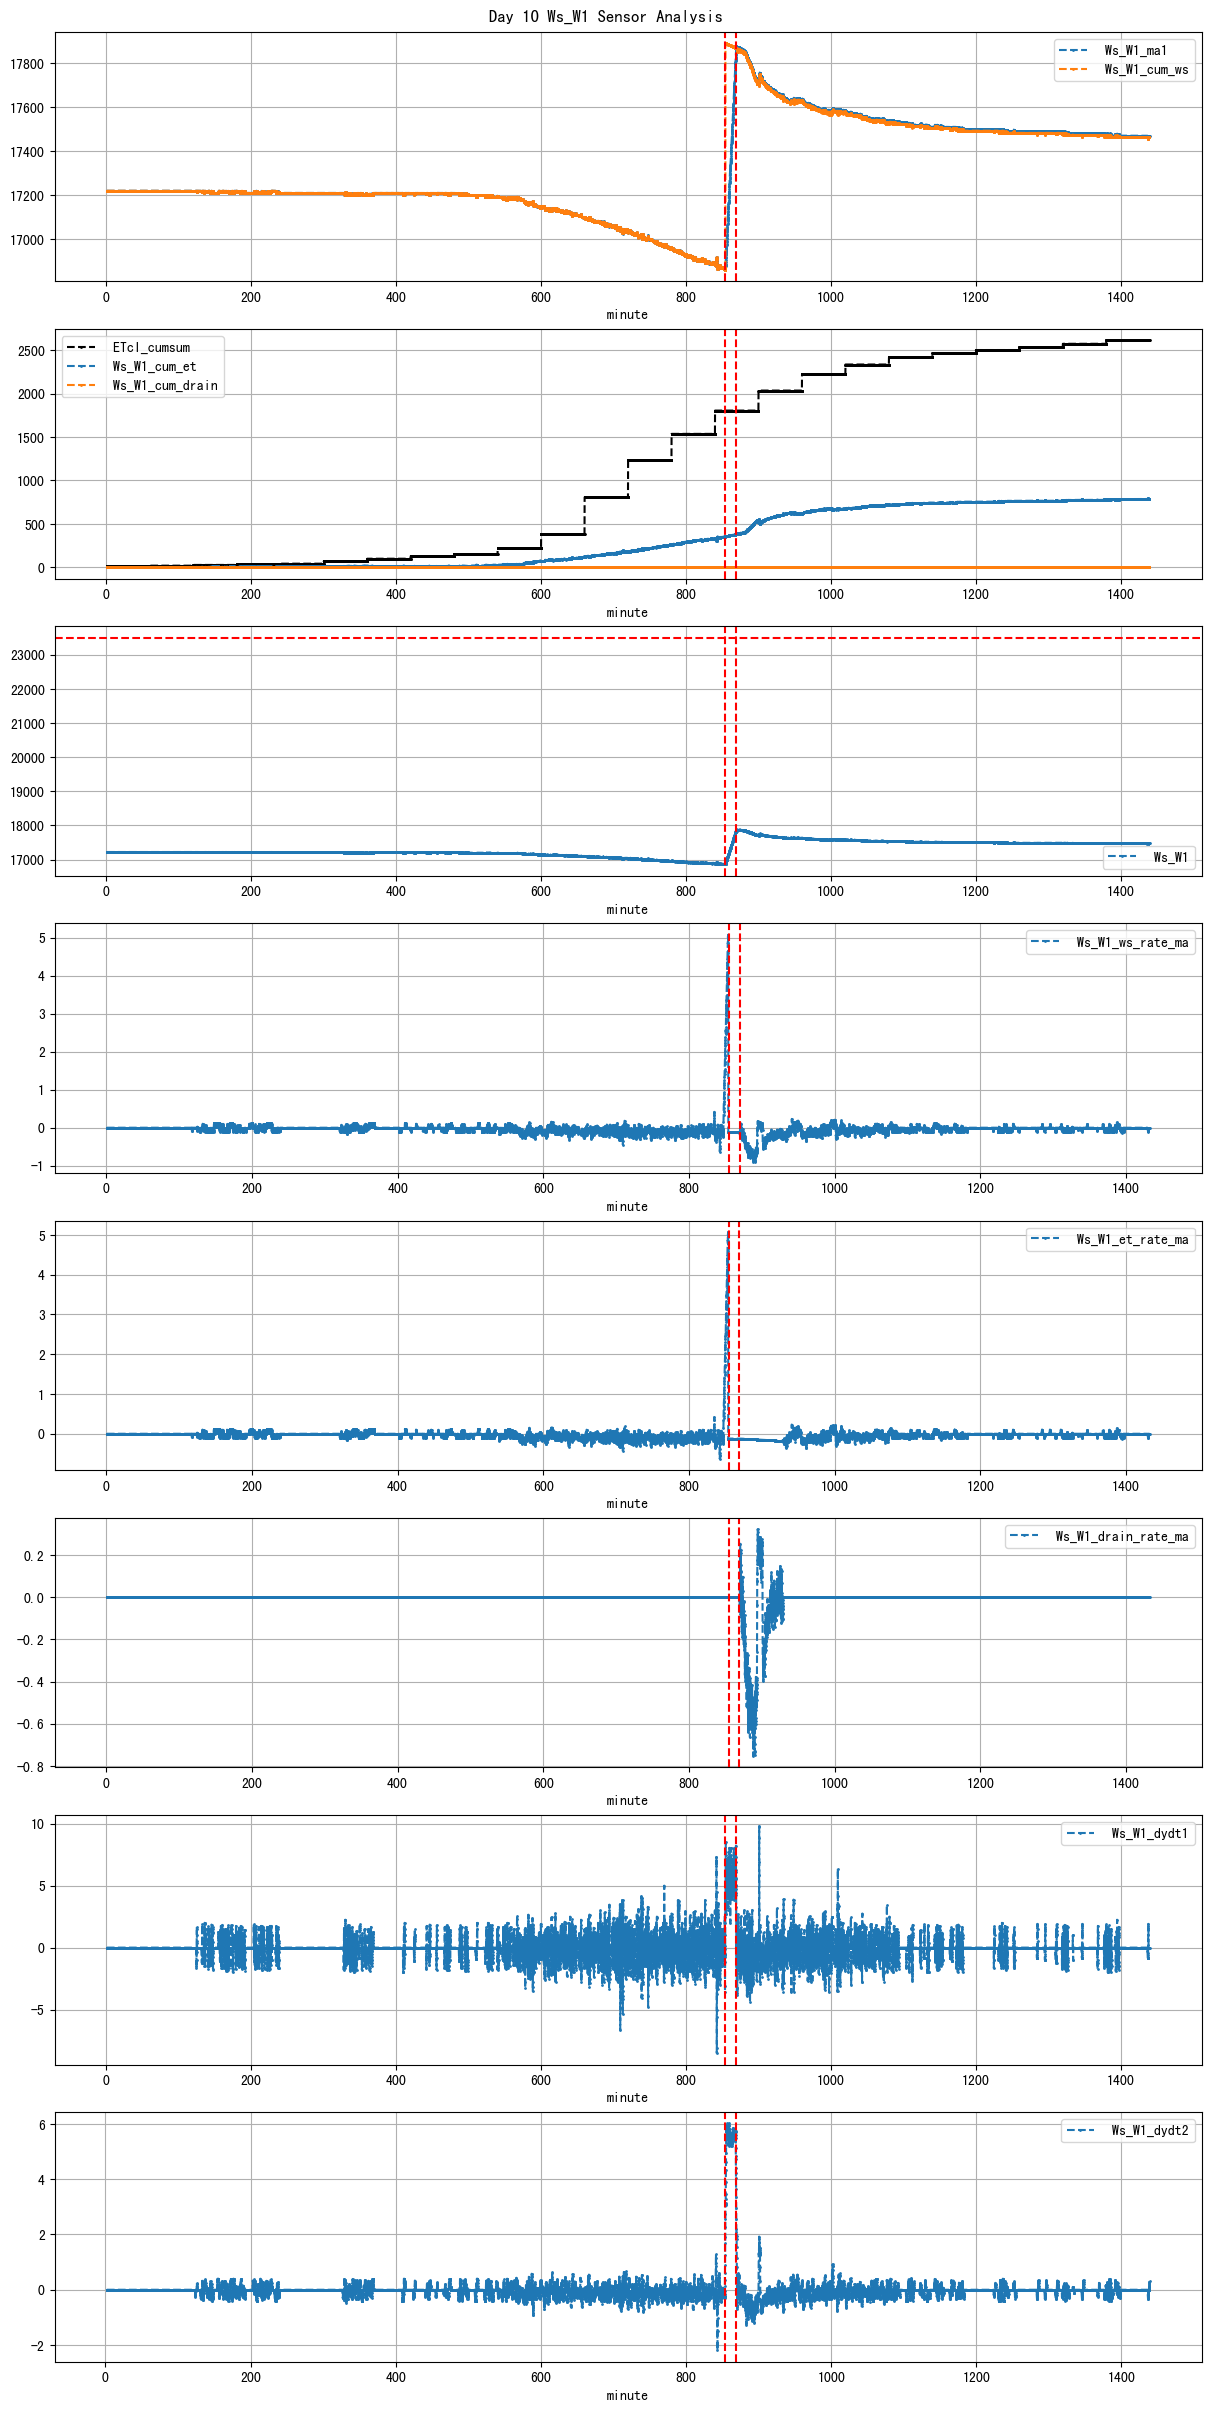
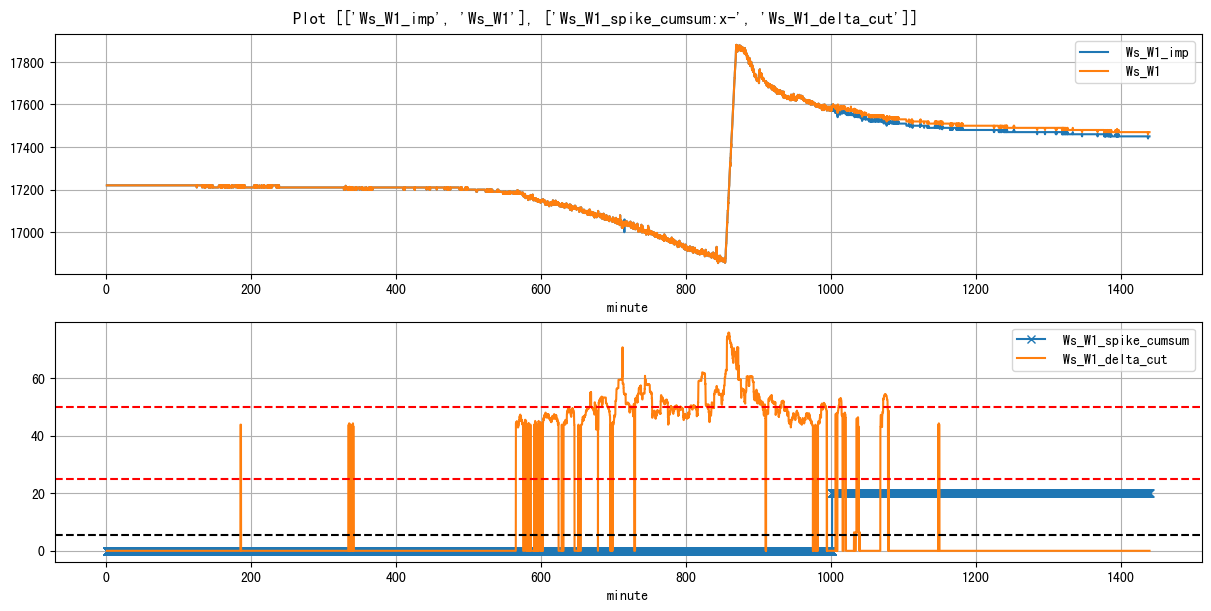
| Ws_W1 | 17,268 | 15,303 | 0 | 10 | 20.00 |
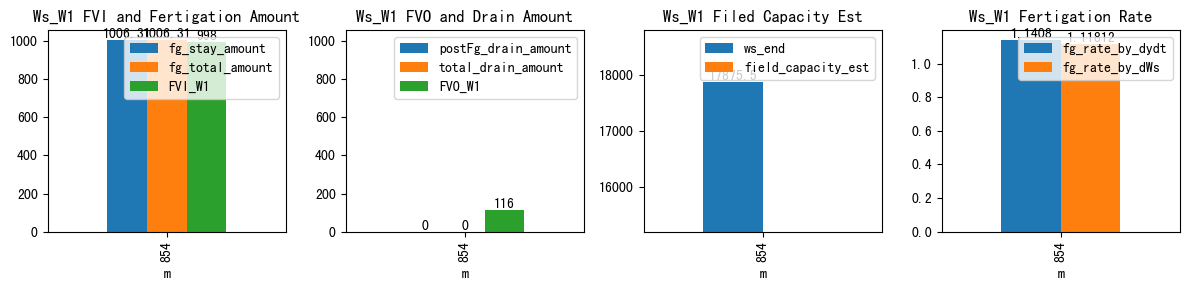
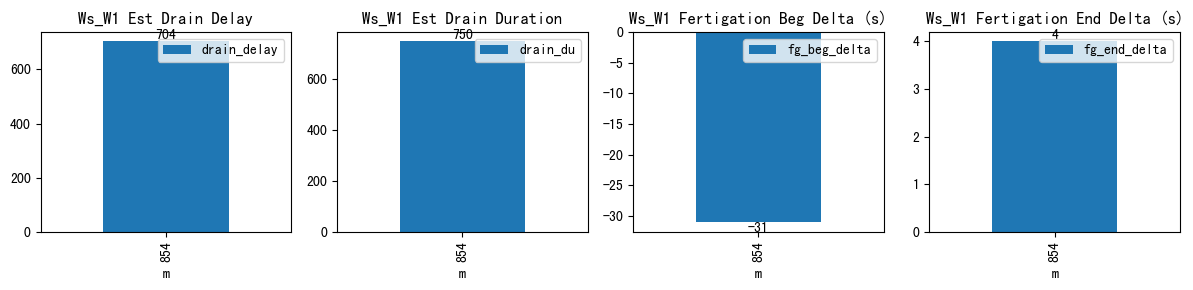
| ds | d | m | ws_name | prominence_cut | max_drain_du | fg_beg | fg_beg_est | fg_end | fg_end_est | ws_beg | ws_end | duc | pre_fg_et | post_fg_ws | post_drn_et | fg_rate_by_dydt | fg_rate_by_dWs | fg_stay_amount | enough_data | fg_beg_delta | fg_end_delta | fg_total_amount | fg_drain_amount | postFg_drain_amount | total_drain_amount | drain_du | drain_delay | drain_rate | field_capacity_est | FVI_W1 | FVO_W1 | FVI_W2 | FVO_W2 |
|---|---|---|---|---|---|---|---|---|---|---|---|---|---|---|---|---|---|---|---|---|---|---|---|---|---|---|---|---|---|---|---|---|---|
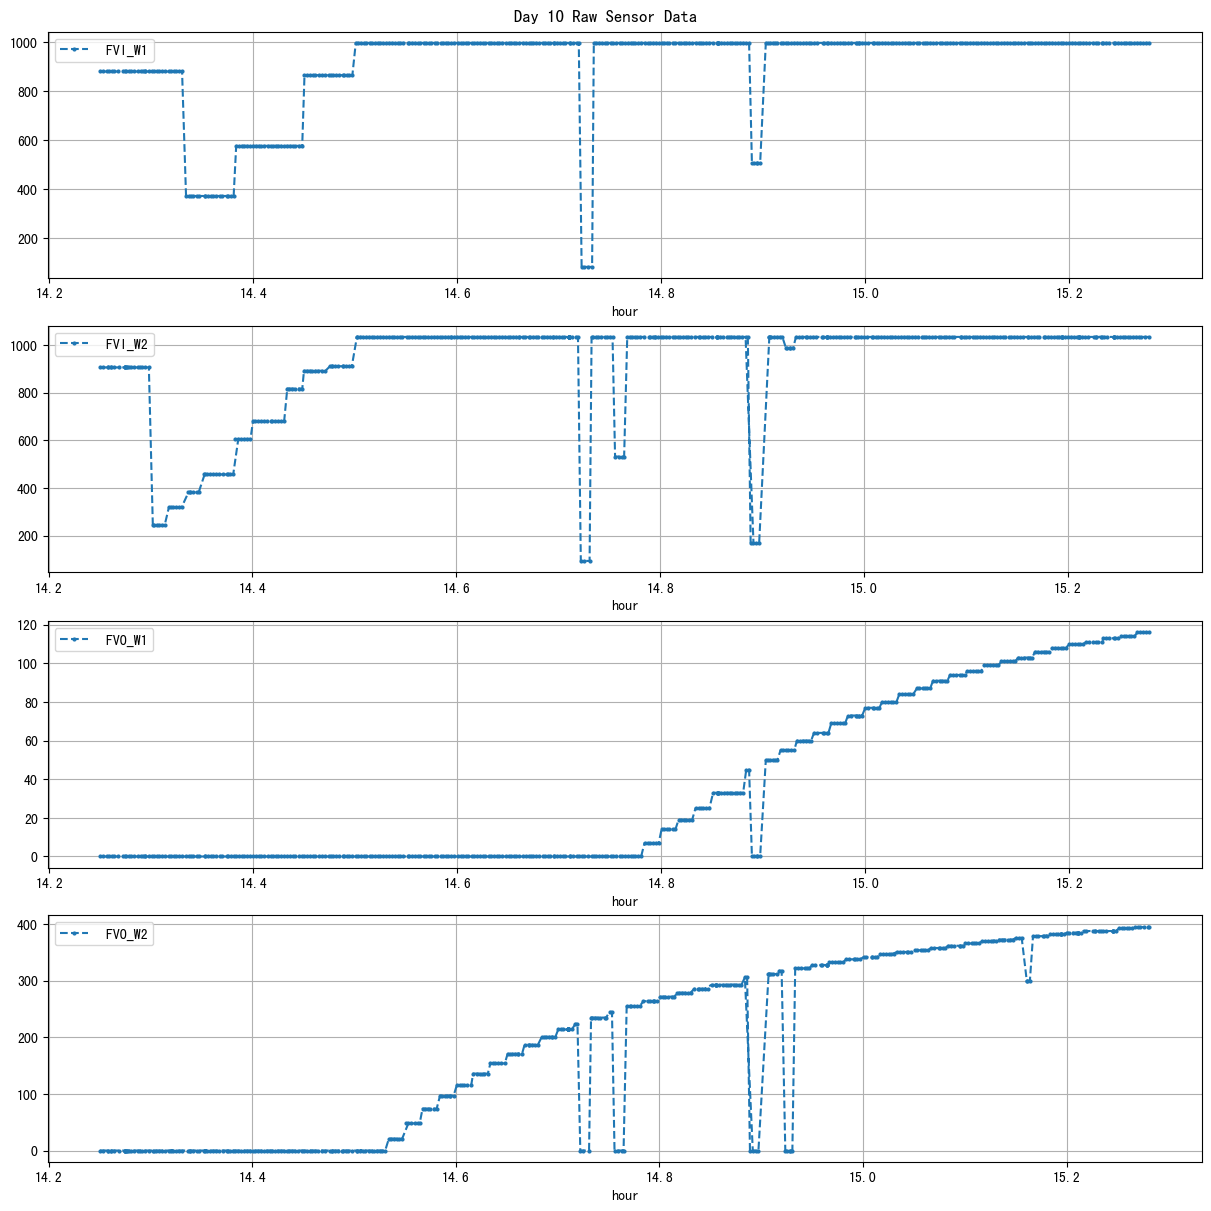
| 2026-03-11 14:14:21+08:00 | 10 | 854 | Ws_W1 | 0.796108 | 60 | 854.35 | 853.833333 | 869.35 | 869.416667 | 16869.166667 | 17875.47619 | 900 | -0.120865 | -0.177319 | -0.180453 | 1.1408 | 1.118122 | 1006.309524 | True | -31.0 | 4.0 | 1006.309524 | 0.0 | 0.0 | 0.0 | 750 | 704 | -0.615255 | NaN | 998.0 | 116.0 | NaN | NaN |
| ws_name | num_dp | num_nan_raw | num_nan_final | num_spike | cum_step_adj |
|---|---|---|---|---|---|
| Ws_W2 | 17,268 | 15,545 | 0 | 0 | 0.00 |
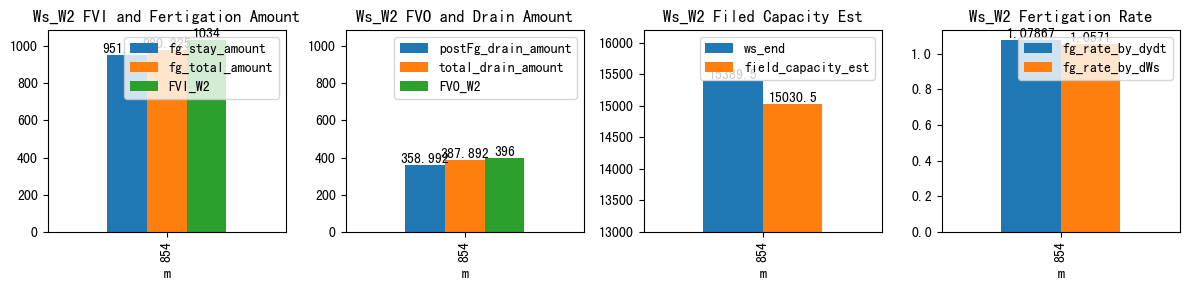
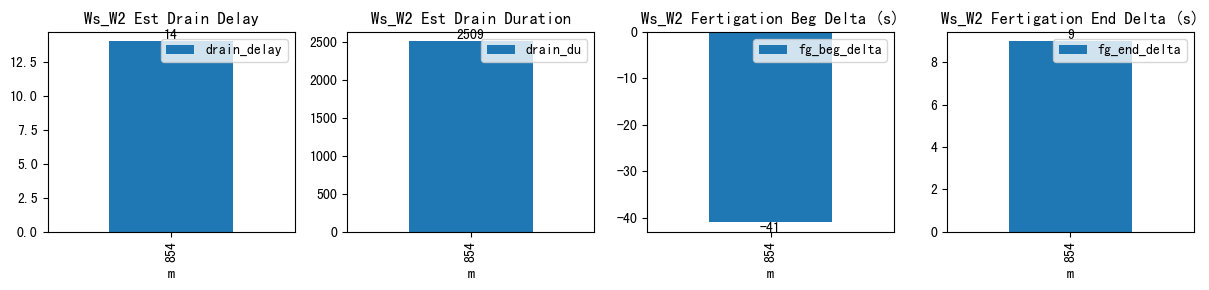
| ds | d | m | ws_name | prominence_cut | max_drain_du | fg_beg | fg_beg_est | fg_end | fg_end_est | ws_beg | ws_end | duc | pre_fg_et | post_fg_ws | post_drn_et | fg_rate_by_dydt | fg_rate_by_dWs | fg_stay_amount | enough_data | fg_beg_delta | fg_end_delta | fg_total_amount | fg_drain_amount | postFg_drain_amount | total_drain_amount | drain_du | drain_delay | drain_rate | field_capacity_est | FVI_W1 | FVO_W1 | FVI_W2 | FVO_W2 |
|---|---|---|---|---|---|---|---|---|---|---|---|---|---|---|---|---|---|---|---|---|---|---|---|---|---|---|---|---|---|---|---|---|---|
| 2026-03-11 14:14:21+08:00 | 10 | 854 | Ws_W2 | 1.004723 | 60 | 854.35 | 853.666667 | 869.35 | 869.5 | 14438.111111 | 15389.5 | 900 | -0.061422 | -1.435185 | -0.210084 | 1.078667 | 1.057099 | 951.388889 | True | -41.0 | 9.0 | 980.325 | 28.9 | 358.991727 | 387.891727 | 2509 | 14 | -1.494474 | 15030.508273 | NaN | NaN | 1034.0 | 396.0 |