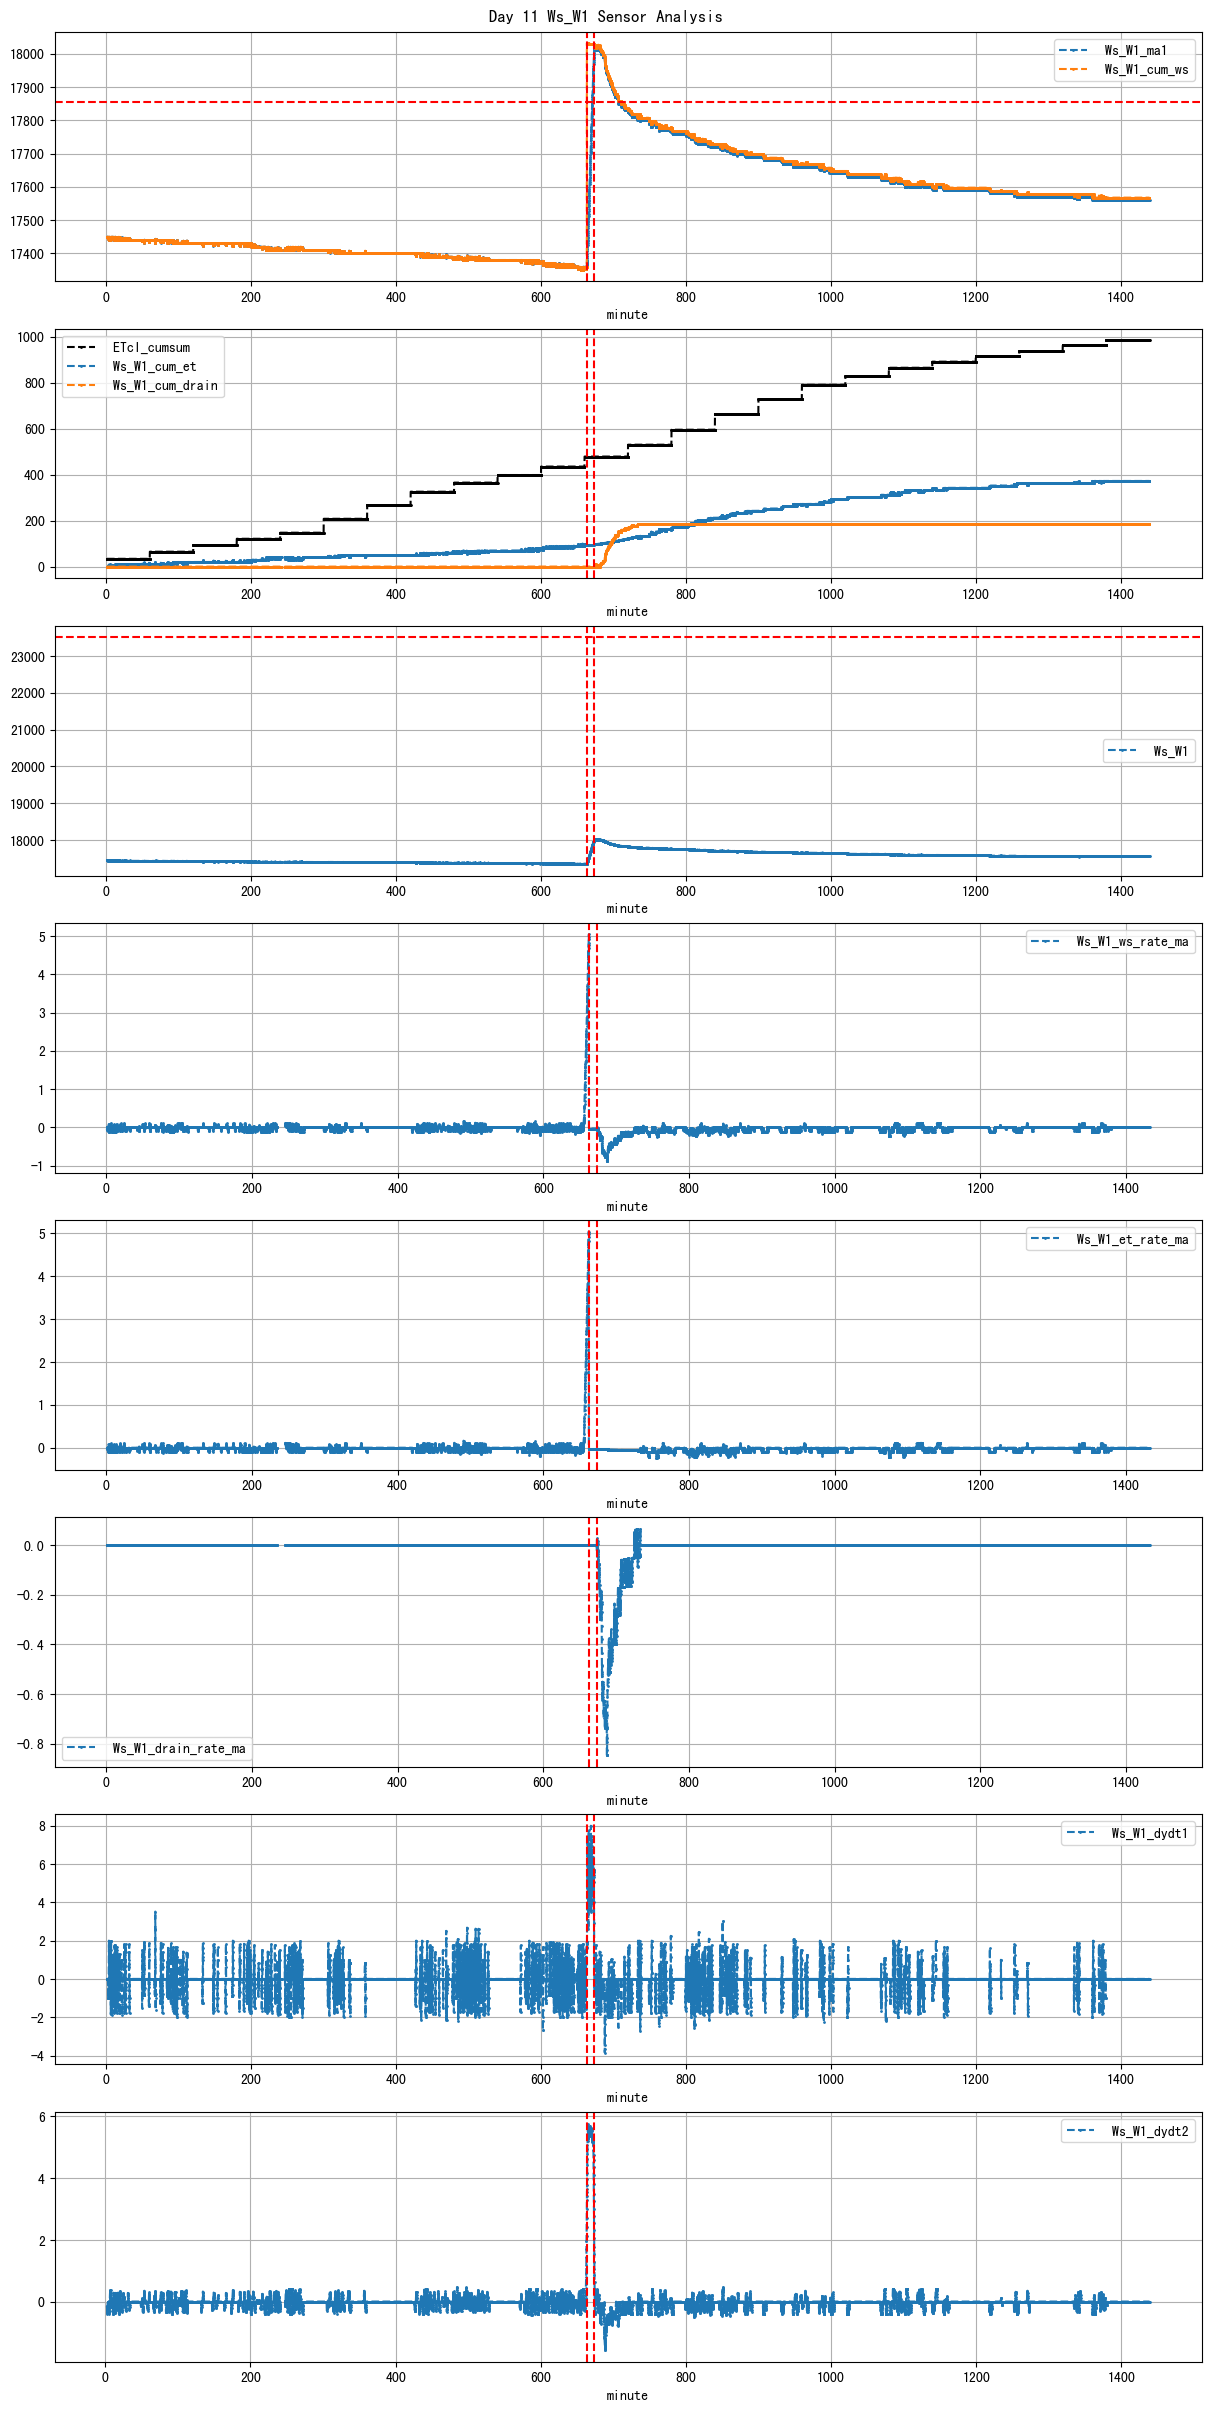
VI and VO Daily Summary
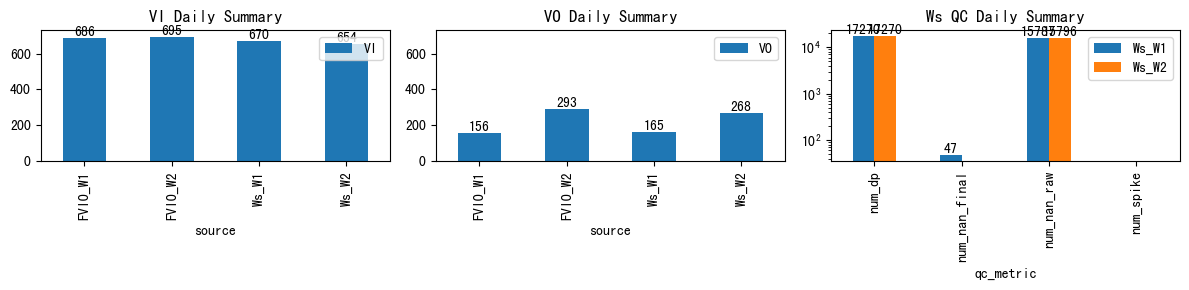
| ws_name | num_dp | num_nan_raw | num_nan_final | num_spike | cum_step_adj |
|---|---|---|---|---|---|
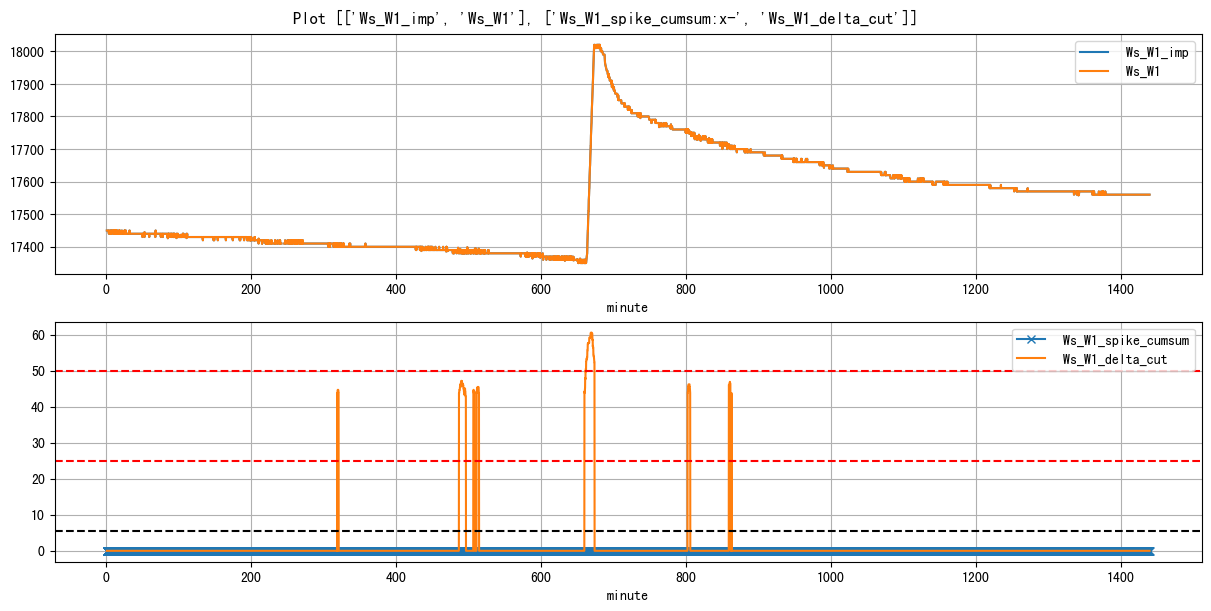
| Ws_W1 | 17,270 | 15,787 | 47 | 0 | 0.00 |
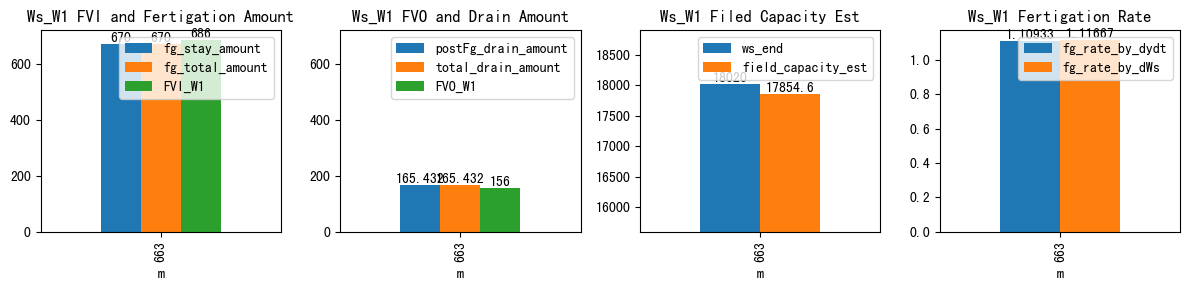
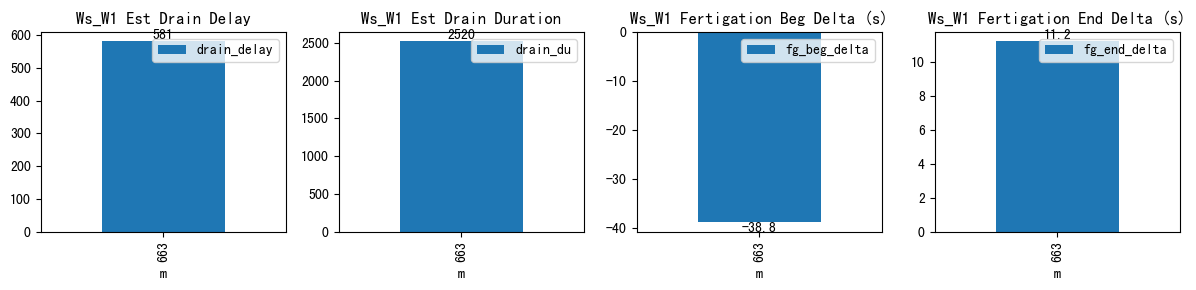
| ds | d | m | ws_name | prominence_cut | max_drain_du | fg_beg | fg_beg_est | fg_end | fg_end_est | ws_beg | ws_end | duc | pre_fg_et | post_fg_ws | post_drn_et | fg_rate_by_dydt | fg_rate_by_dWs | fg_stay_amount | enough_data | fg_beg_delta | fg_end_delta | fg_total_amount | fg_drain_amount | postFg_drain_amount | total_drain_amount | drain_du | drain_delay | drain_rate | field_capacity_est | FVI_W1 | FVO_W1 | FVI_W2 | FVO_W2 |
|---|---|---|---|---|---|---|---|---|---|---|---|---|---|---|---|---|---|---|---|---|---|---|---|---|---|---|---|---|---|---|---|---|---|
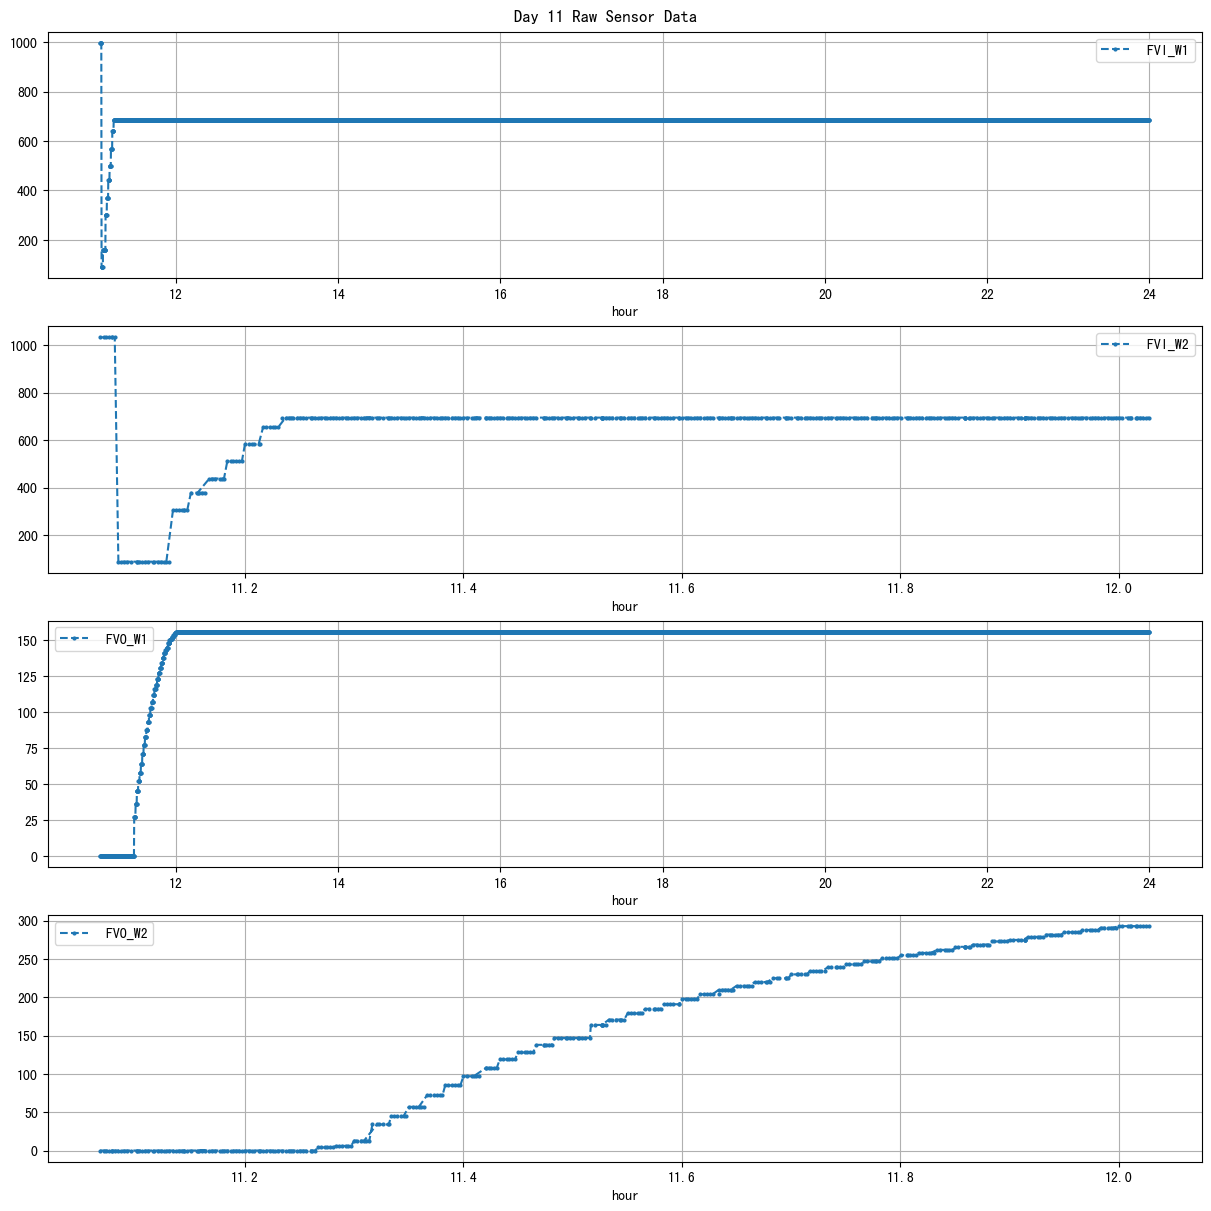
| 2026-03-12 11:03:14+08:00 | 11 | 663 | Ws_W1 | 0.655181 | 60 | 663.23 | 662.583333 | 673.23 | 673.416667 | 17350.0 | 18020.0 | 600 | -0.032994 | -0.200882 | -0.066667 | 1.109333 | 1.116667 | 670.0 | True | -38.8 | 11.2 | 670.0 | 0.0 | 165.431837 | 165.431837 | 2520 | 581 | -0.689058 | 17854.568163 | 686.0 | 156.0 | NaN | NaN |
| ws_name | num_dp | num_nan_raw | num_nan_final | num_spike | cum_step_adj |
|---|---|---|---|---|---|
| Ws_W2 | 17,270 | 15,796 | 0 | 0 | 0.00 |
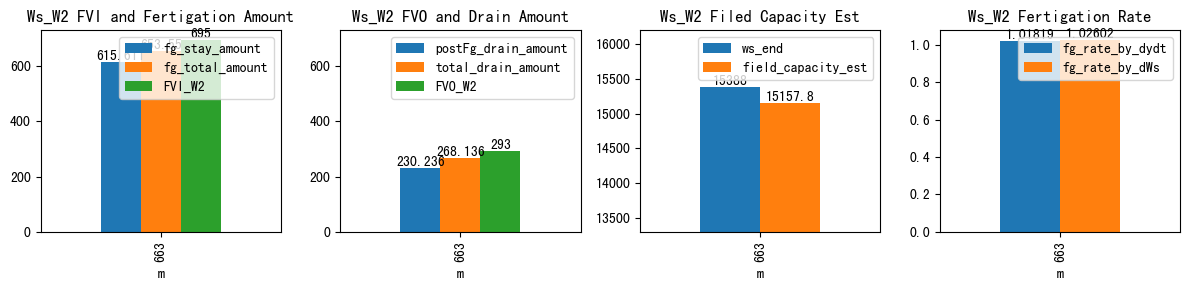
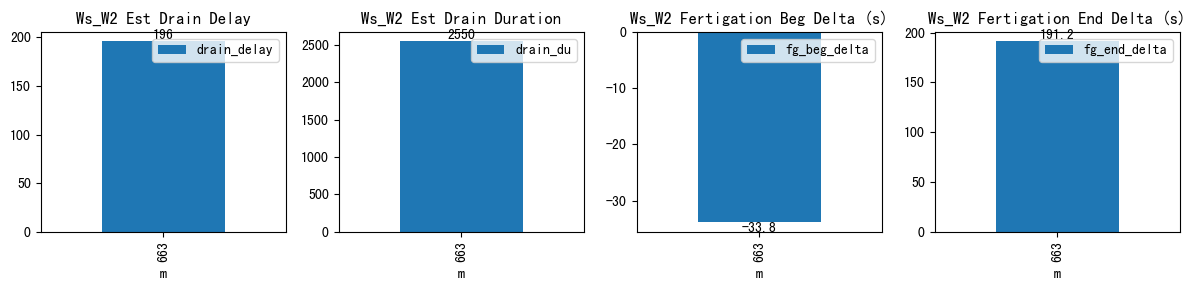
| ds | d | m | ws_name | prominence_cut | max_drain_du | fg_beg | fg_beg_est | fg_end | fg_end_est | ws_beg | ws_end | duc | pre_fg_et | post_fg_ws | post_drn_et | fg_rate_by_dydt | fg_rate_by_dWs | fg_stay_amount | enough_data | fg_beg_delta | fg_end_delta | fg_total_amount | fg_drain_amount | postFg_drain_amount | total_drain_amount | drain_du | drain_delay | drain_rate | field_capacity_est | FVI_W1 | FVO_W1 | FVI_W2 | FVO_W2 |
|---|---|---|---|---|---|---|---|---|---|---|---|---|---|---|---|---|---|---|---|---|---|---|---|---|---|---|---|---|---|---|---|---|---|
| 2026-03-12 11:03:14+08:00 | 11 | 663 | Ws_W2 | 1.113985 | 60 | 663.23 | 662.666667 | 673.23 | 676.416667 | 14772.388889 | 15388.0 | 600 | 0.0 | -0.847222 | -0.198765 | 1.01819 | 1.026019 | 615.611111 | True | -33.8 | 191.2 | 653.55 | 37.9 | 230.236302 | 268.136302 | 2550 | 196 | -0.873631 | 15157.763698 | NaN | NaN | 695.0 | 293.0 |