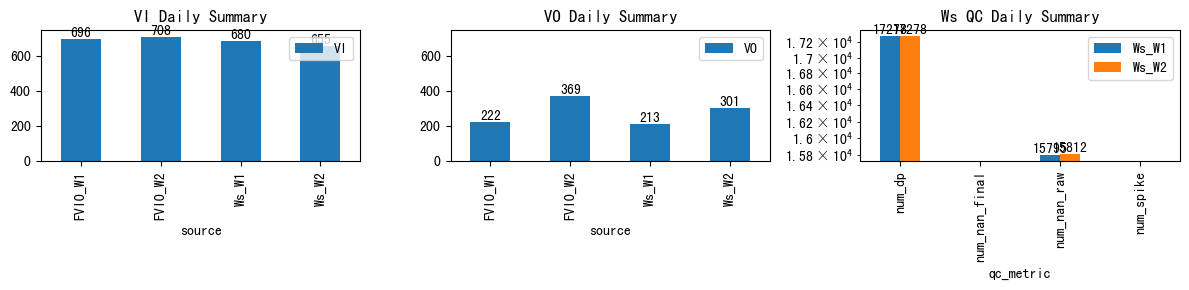
VI and VO Daily Summary
| ws_name | num_dp | num_nan_raw | num_nan_final | num_spike | cum_step_adj |
|---|---|---|---|---|---|
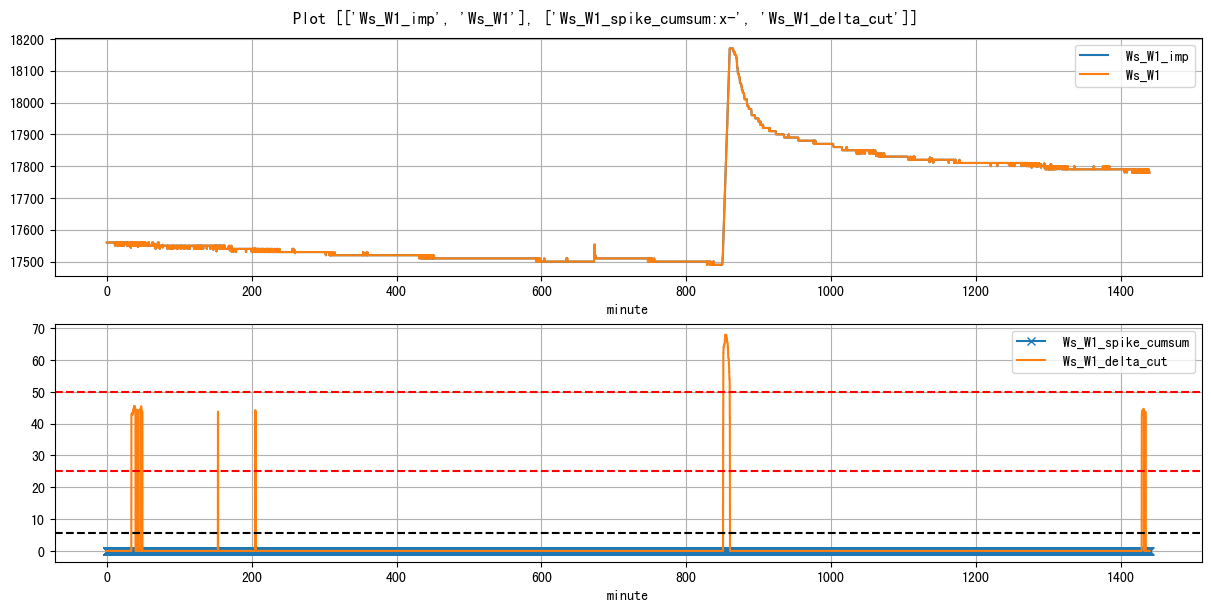
| Ws_W1 | 17,278 | 15,795 | 0 | 0 | 0.00 |
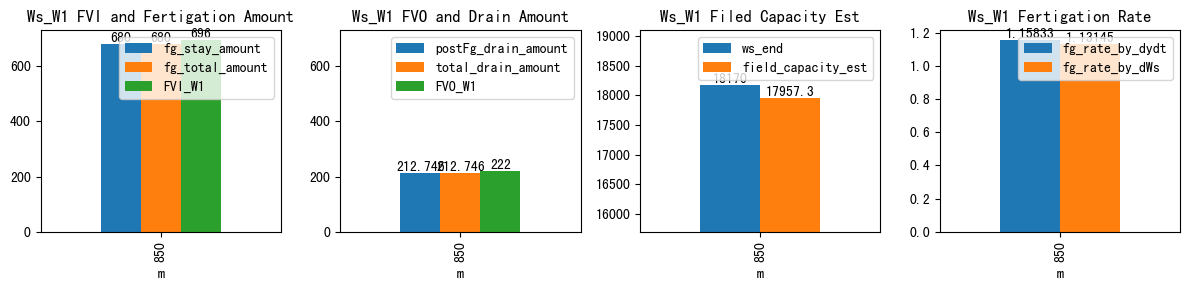
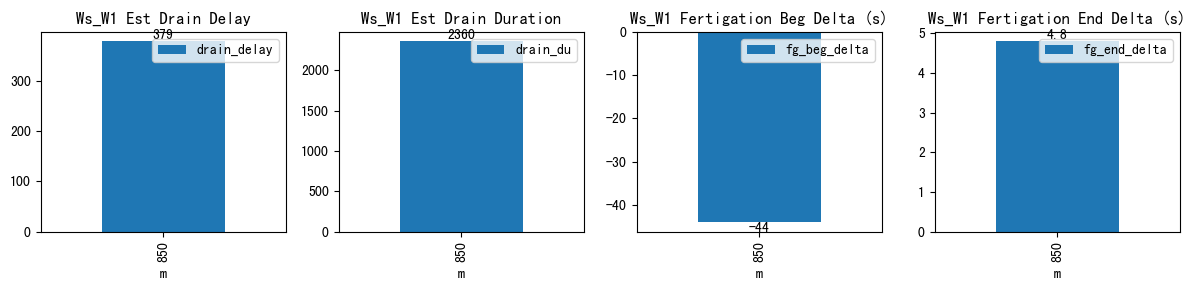
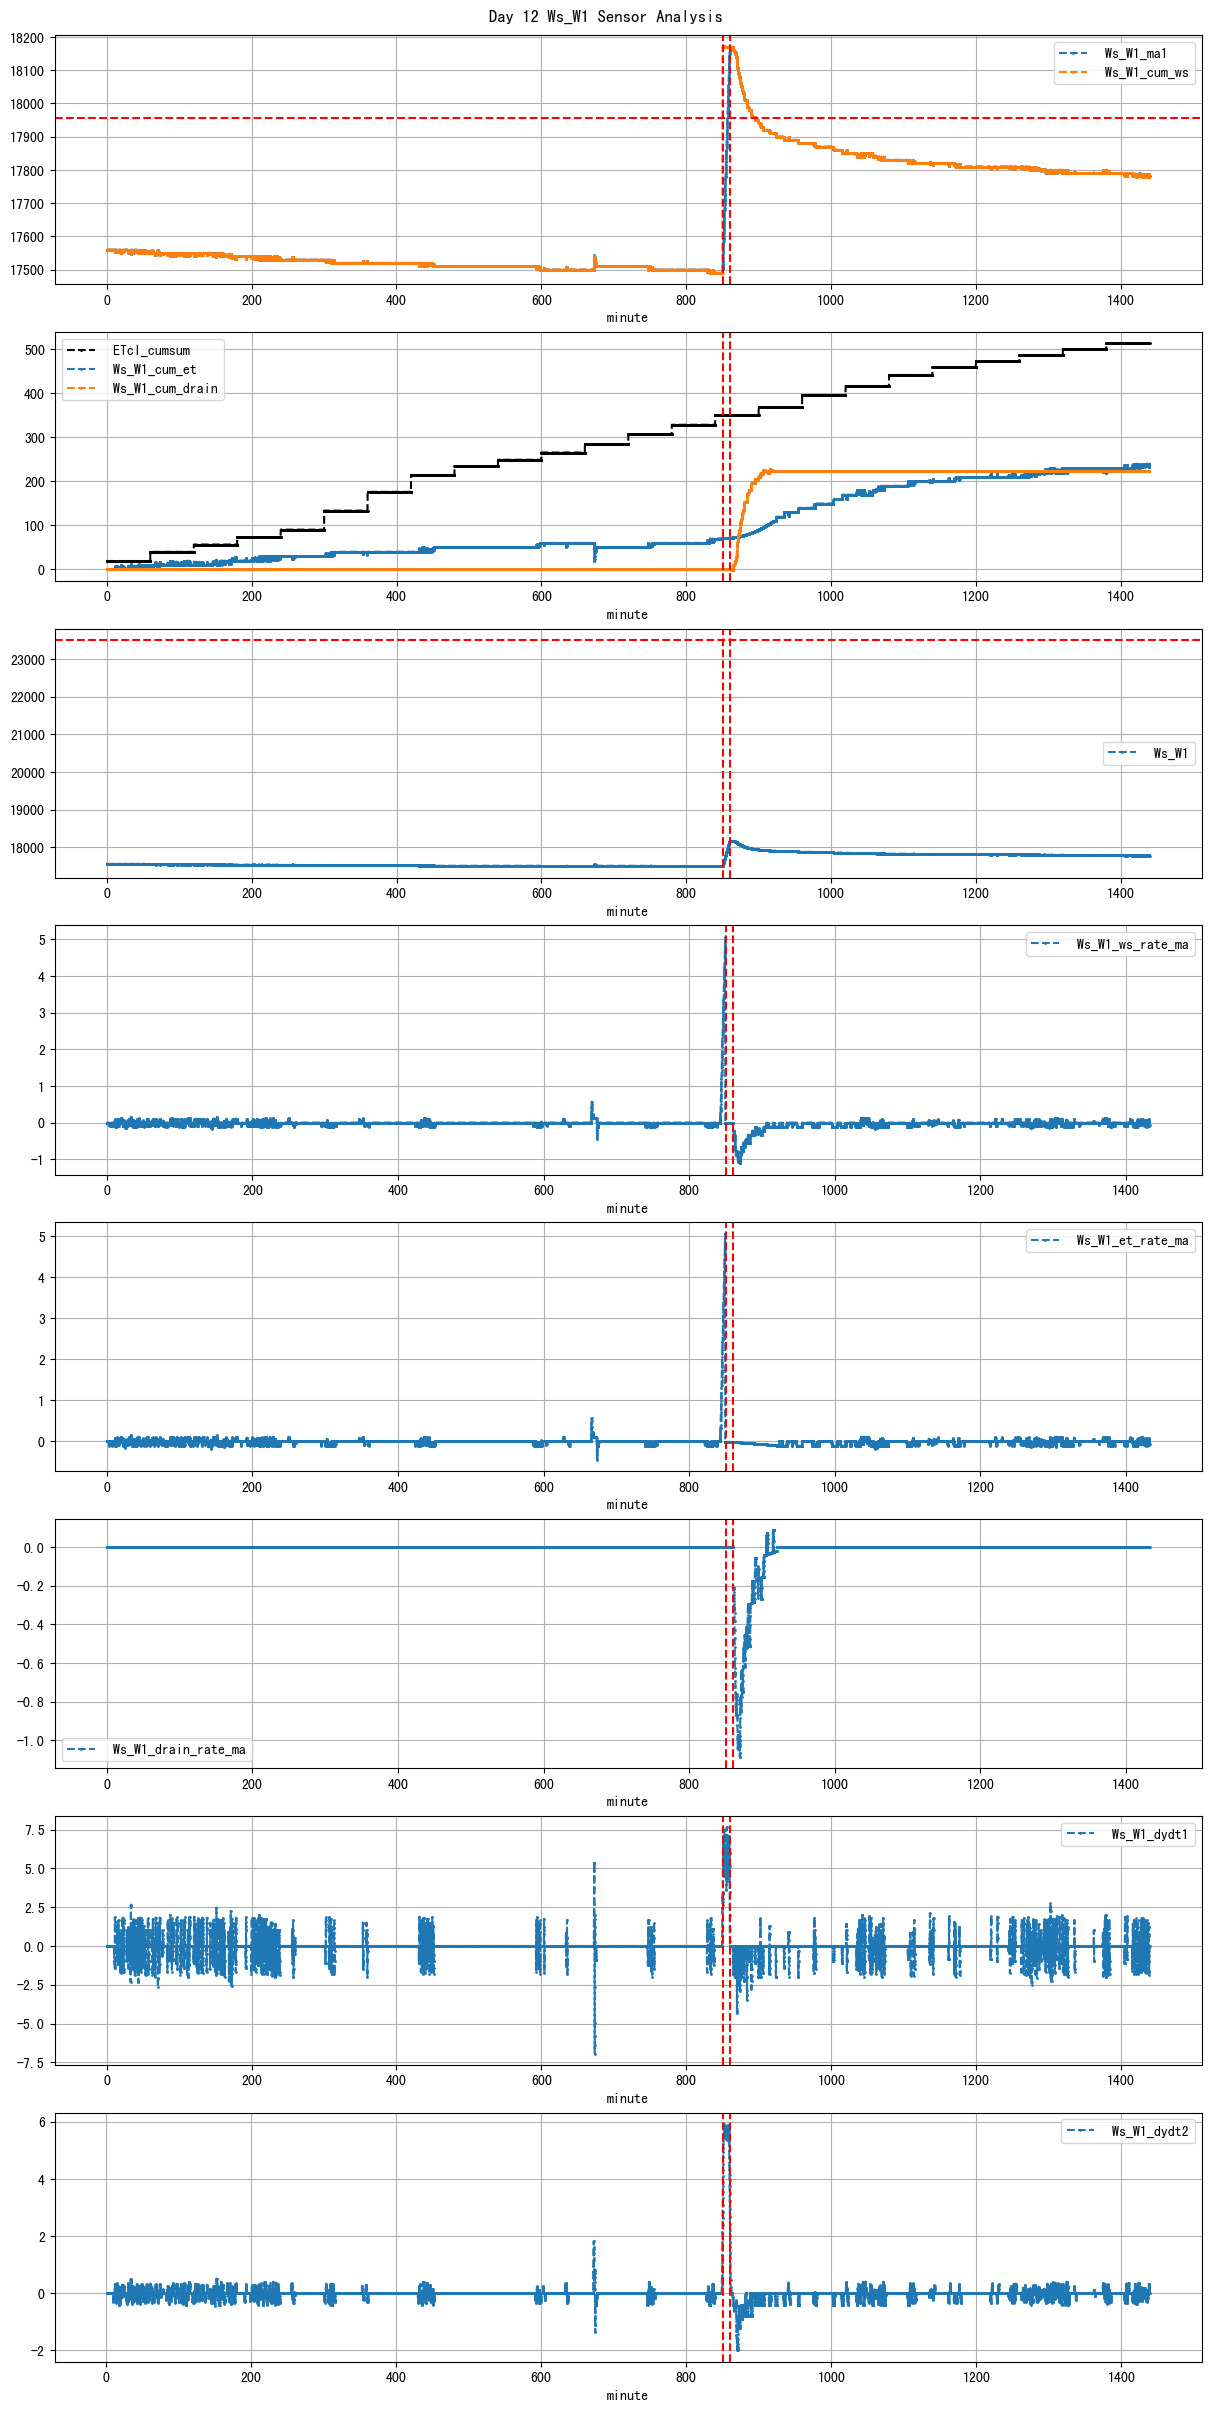
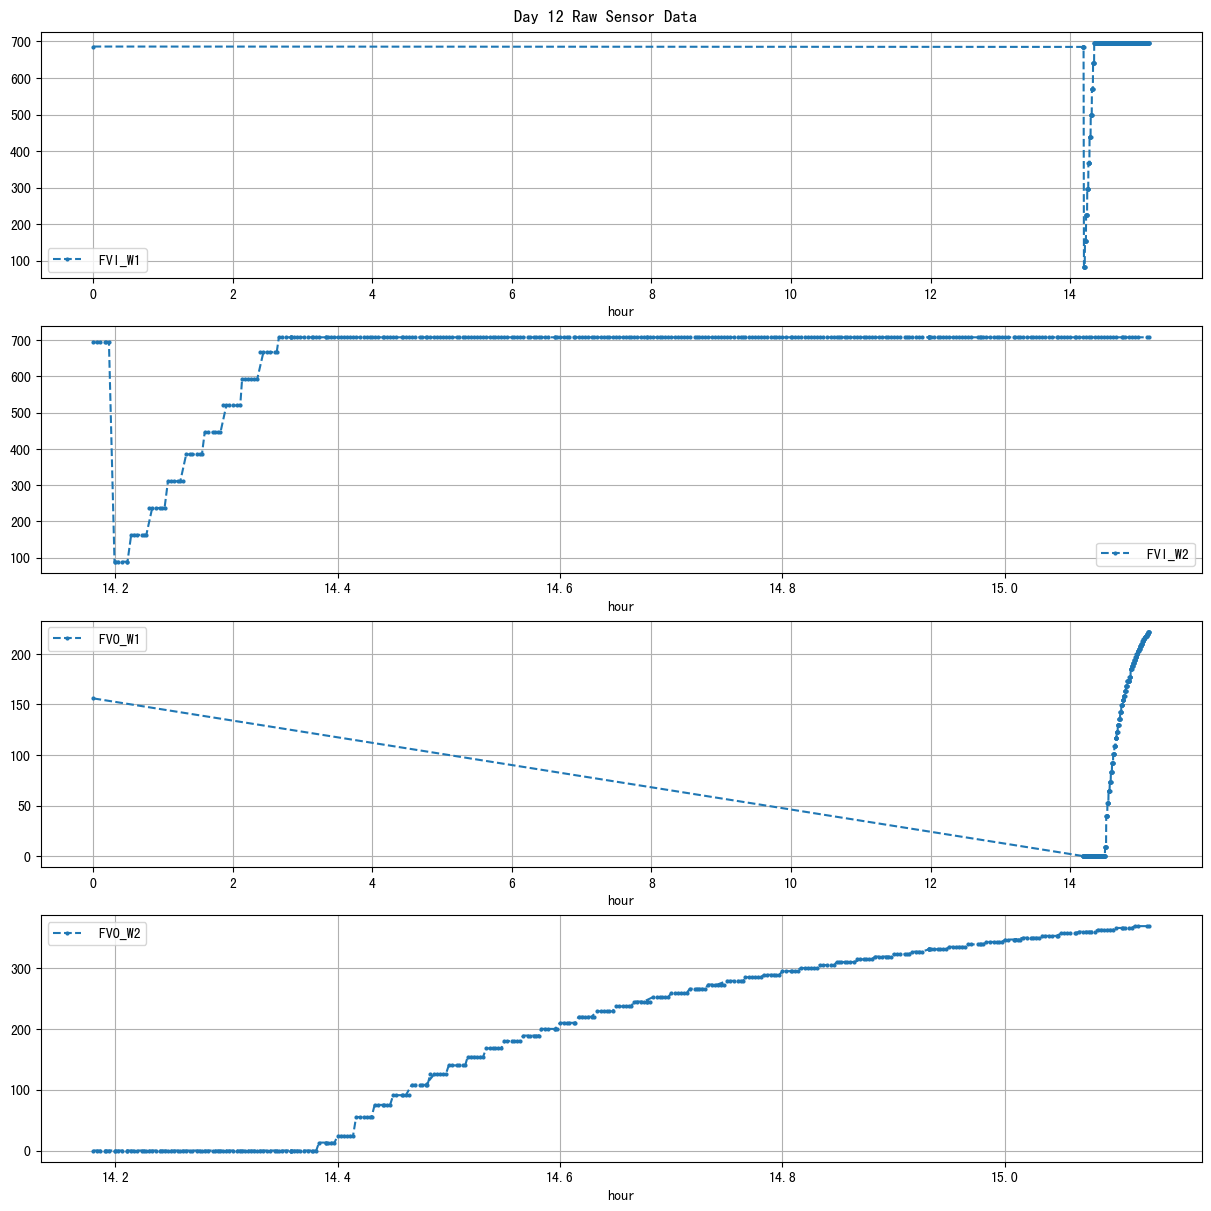
| ds | d | m | ws_name | prominence_cut | max_drain_du | fg_beg | fg_beg_est | fg_end | fg_end_est | ws_beg | ws_end | duc | pre_fg_et | post_fg_ws | post_drn_et | fg_rate_by_dydt | fg_rate_by_dWs | fg_stay_amount | enough_data | fg_beg_delta | fg_end_delta | fg_total_amount | fg_drain_amount | postFg_drain_amount | total_drain_amount | drain_du | drain_delay | drain_rate | field_capacity_est | FVI_W1 | FVO_W1 | FVI_W2 | FVO_W2 |
|---|---|---|---|---|---|---|---|---|---|---|---|---|---|---|---|---|---|---|---|---|---|---|---|---|---|---|---|---|---|---|---|---|---|
| 2026-03-13 14:10:09+08:00 | 12 | 850 | Ws_W1 | 0.703943 | 60 | 850.15 | 849.416667 | 860.17 | 860.25 | 17490.0 | 18170.0 | 601 | -0.01186 | -0.683333 | -0.09321 | 1.158333 | 1.131448 | 680.0 | True | -44.0 | 4.8 | 680.0 | 0.0 | 212.746486 | 212.746486 | 2360 | 379 | -0.977963 | 17957.253514 | 696.0 | 222.0 | NaN | NaN |
| ws_name | num_dp | num_nan_raw | num_nan_final | num_spike | cum_step_adj |
|---|---|---|---|---|---|
| Ws_W2 | 17,278 | 15,812 | 0 | 0 | 0.00 |
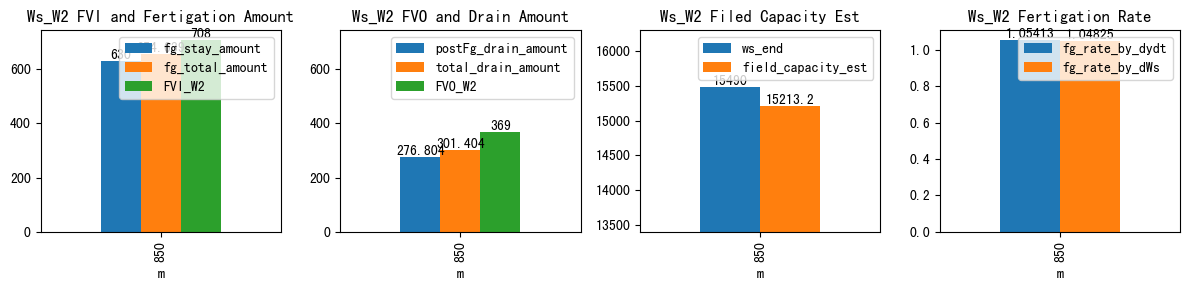
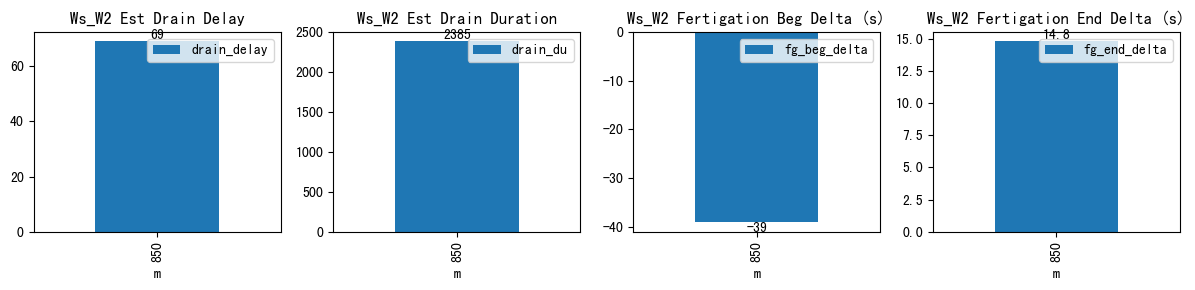
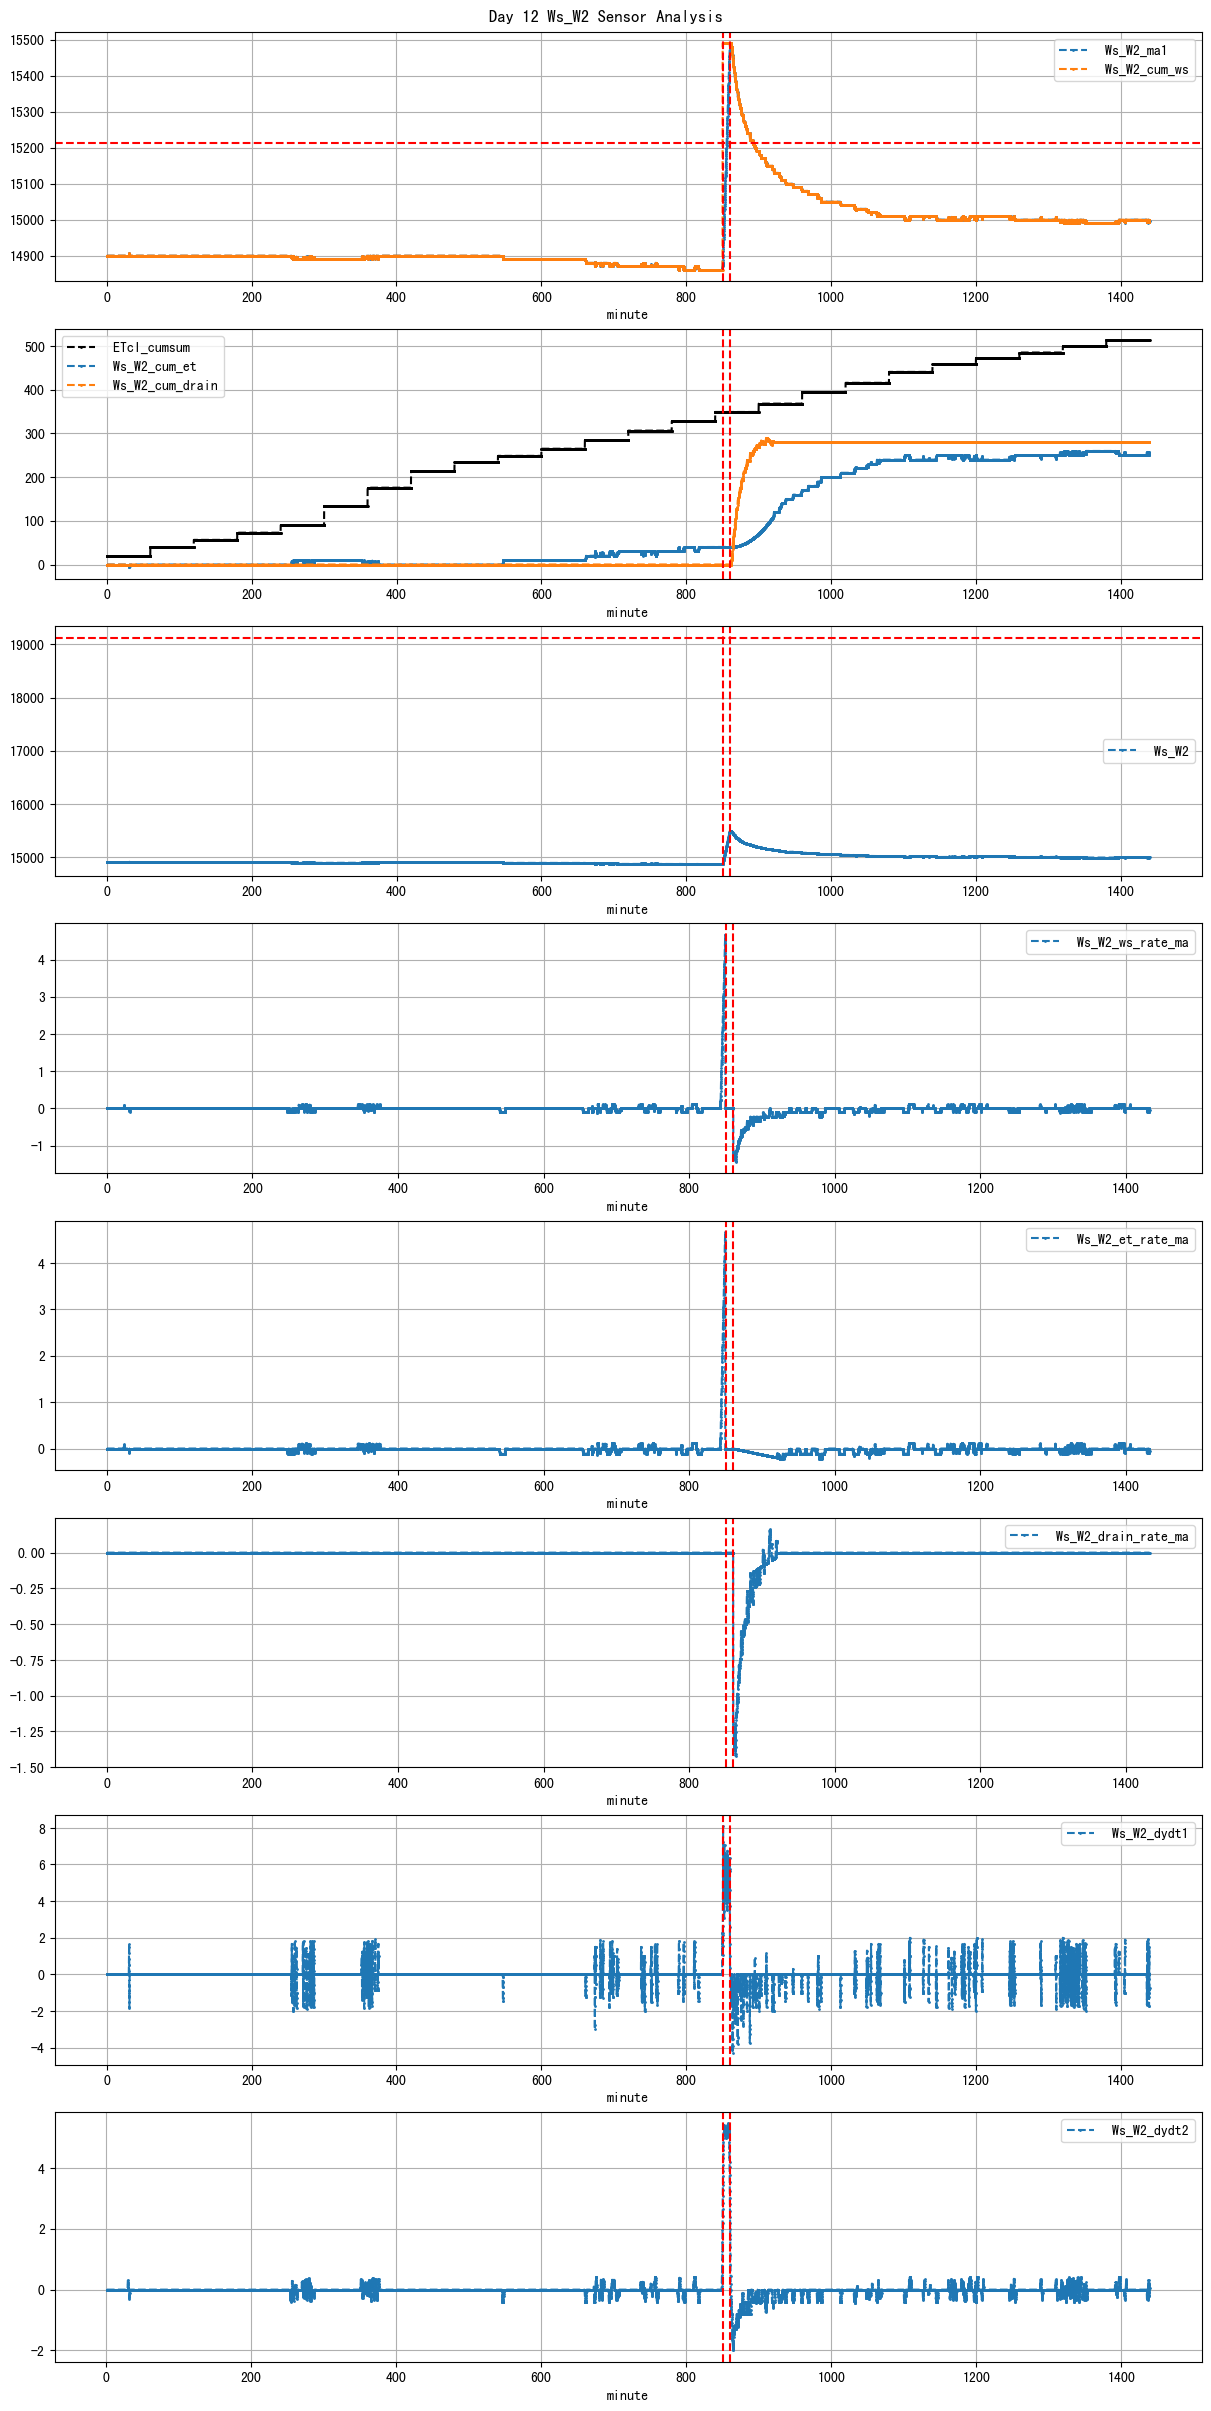
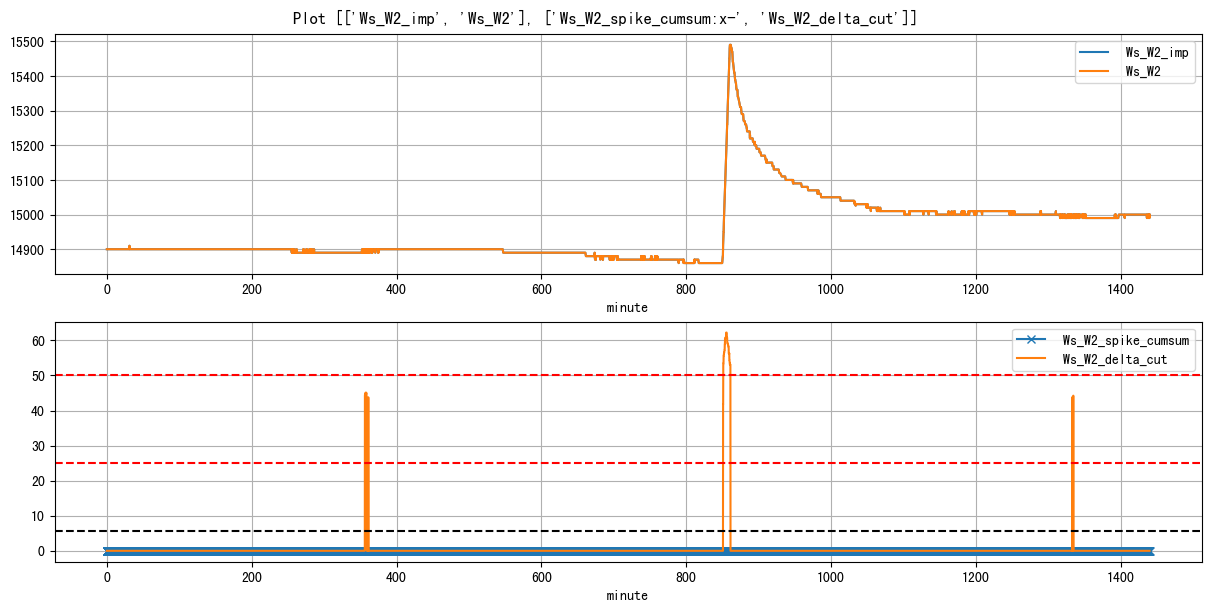
| ds | d | m | ws_name | prominence_cut | max_drain_du | fg_beg | fg_beg_est | fg_end | fg_end_est | ws_beg | ws_end | duc | pre_fg_et | post_fg_ws | post_drn_et | fg_rate_by_dydt | fg_rate_by_dWs | fg_stay_amount | enough_data | fg_beg_delta | fg_end_delta | fg_total_amount | fg_drain_amount | postFg_drain_amount | total_drain_amount | drain_du | drain_delay | drain_rate | field_capacity_est | FVI_W1 | FVO_W1 | FVI_W2 | FVO_W2 |
|---|---|---|---|---|---|---|---|---|---|---|---|---|---|---|---|---|---|---|---|---|---|---|---|---|---|---|---|---|---|---|---|---|---|
| 2026-03-13 14:10:09+08:00 | 12 | 850 | Ws_W2 | 1.42205 | 60 | 850.15 | 849.5 | 860.17 | 860.416667 | 14860.0 | 15490.0 | 601 | 0.0 | -1.168519 | -0.194102 | 1.054133 | 1.048253 | 630.0 | True | -39.0 | 14.8 | 654.63925 | 24.6 | 276.804256 | 301.404256 | 2385 | 69 | -1.233864 | 15213.195744 | NaN | NaN | 708.0 | 369.0 |