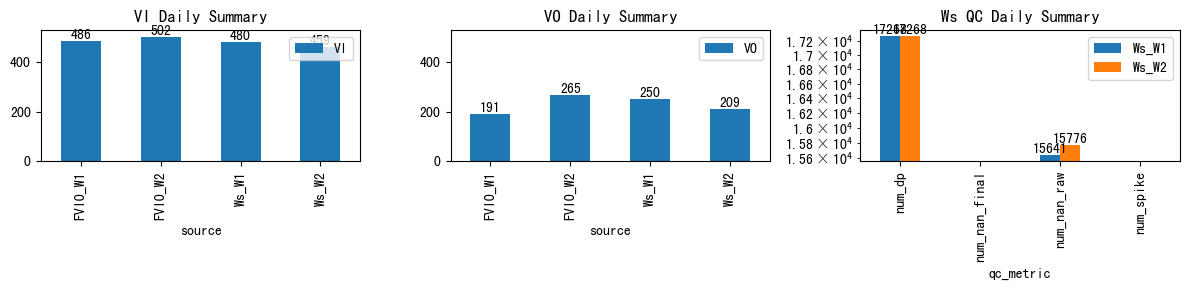
VI and VO Daily Summary
| ws_name | num_dp | num_nan_raw | num_nan_final | num_spike | cum_step_adj |
|---|---|---|---|---|---|
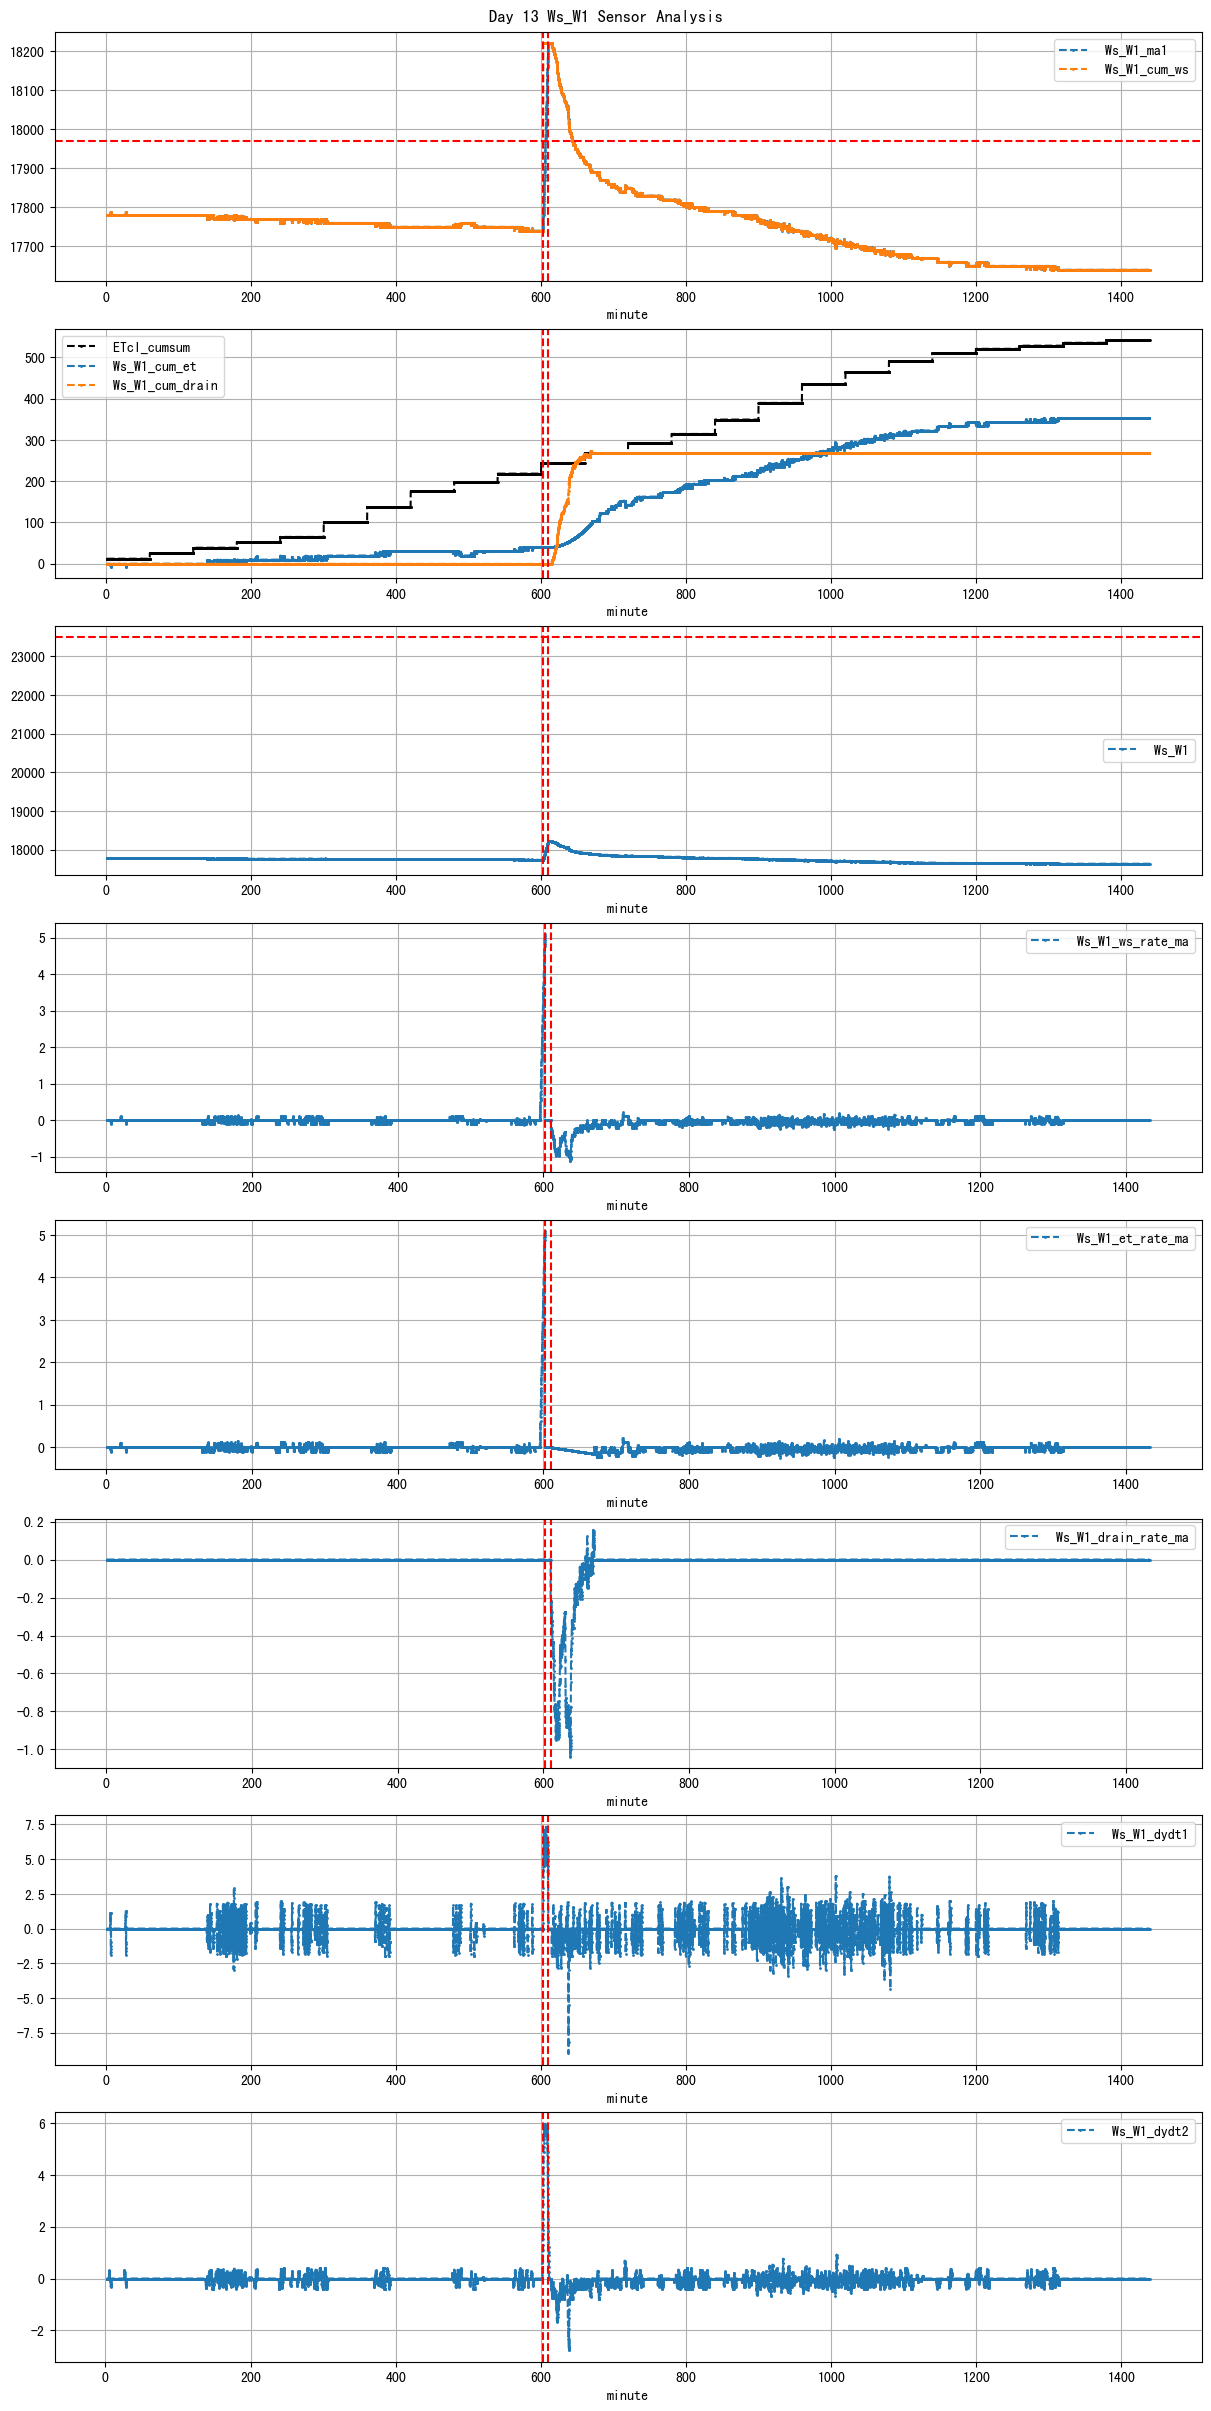
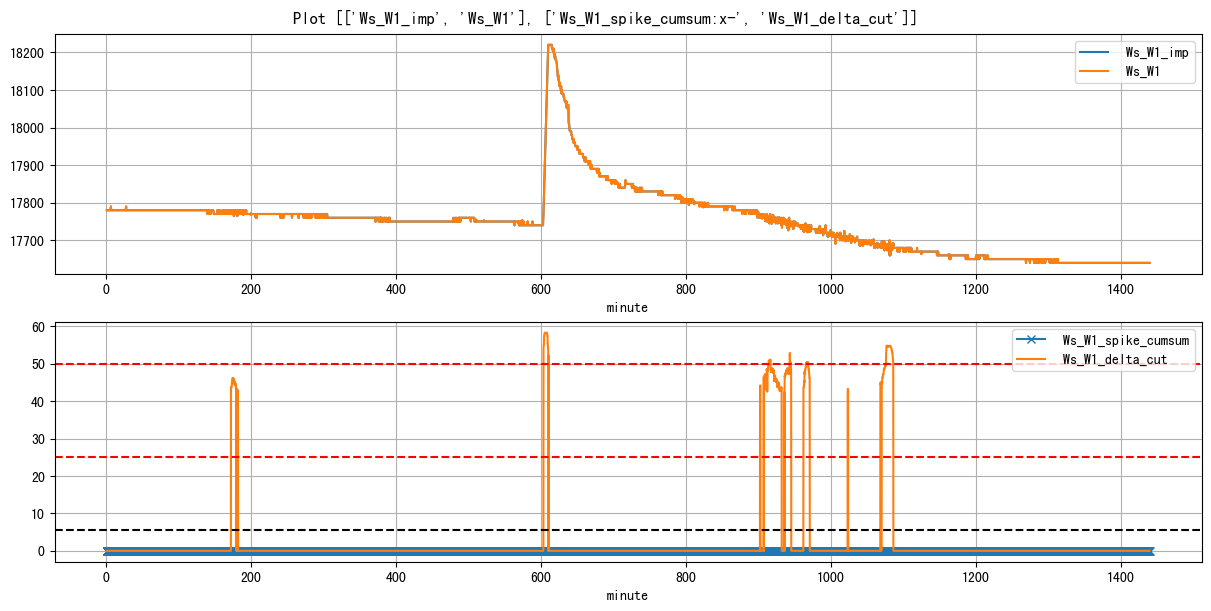
| Ws_W1 | 17,268 | 15,641 | 0 | 0 | 0.00 |
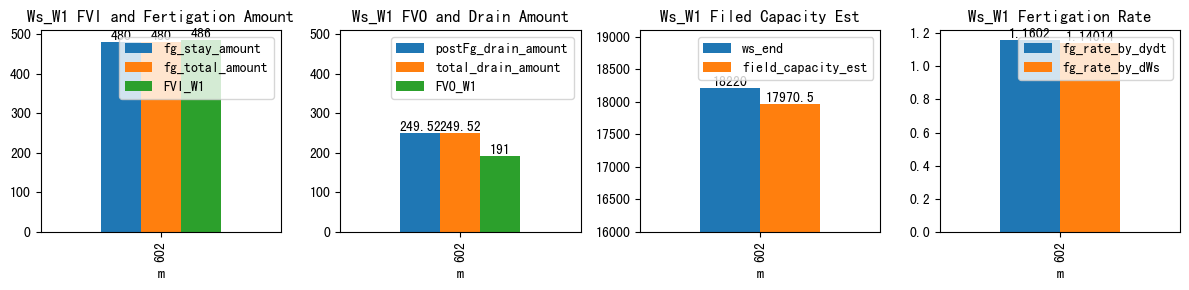
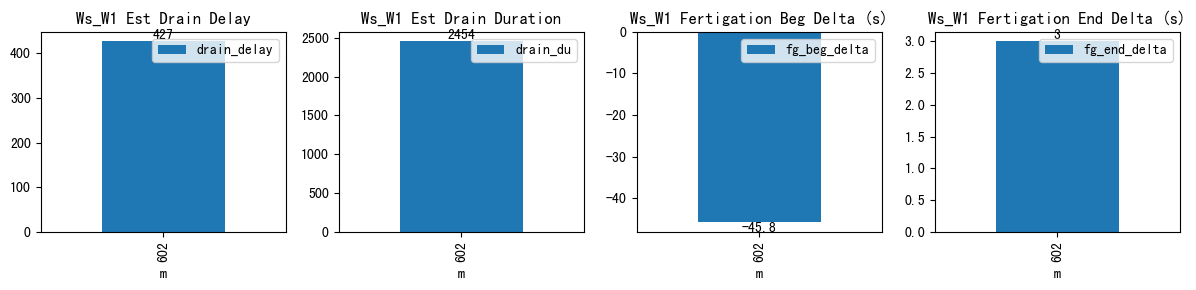
| ds | d | m | ws_name | prominence_cut | max_drain_du | fg_beg | fg_beg_est | fg_end | fg_end_est | ws_beg | ws_end | duc | pre_fg_et | post_fg_ws | post_drn_et | fg_rate_by_dydt | fg_rate_by_dWs | fg_stay_amount | enough_data | fg_beg_delta | fg_end_delta | fg_total_amount | fg_drain_amount | postFg_drain_amount | total_drain_amount | drain_du | drain_delay | drain_rate | field_capacity_est | FVI_W1 | FVO_W1 | FVI_W2 | FVO_W2 |
|---|---|---|---|---|---|---|---|---|---|---|---|---|---|---|---|---|---|---|---|---|---|---|---|---|---|---|---|---|---|---|---|---|---|
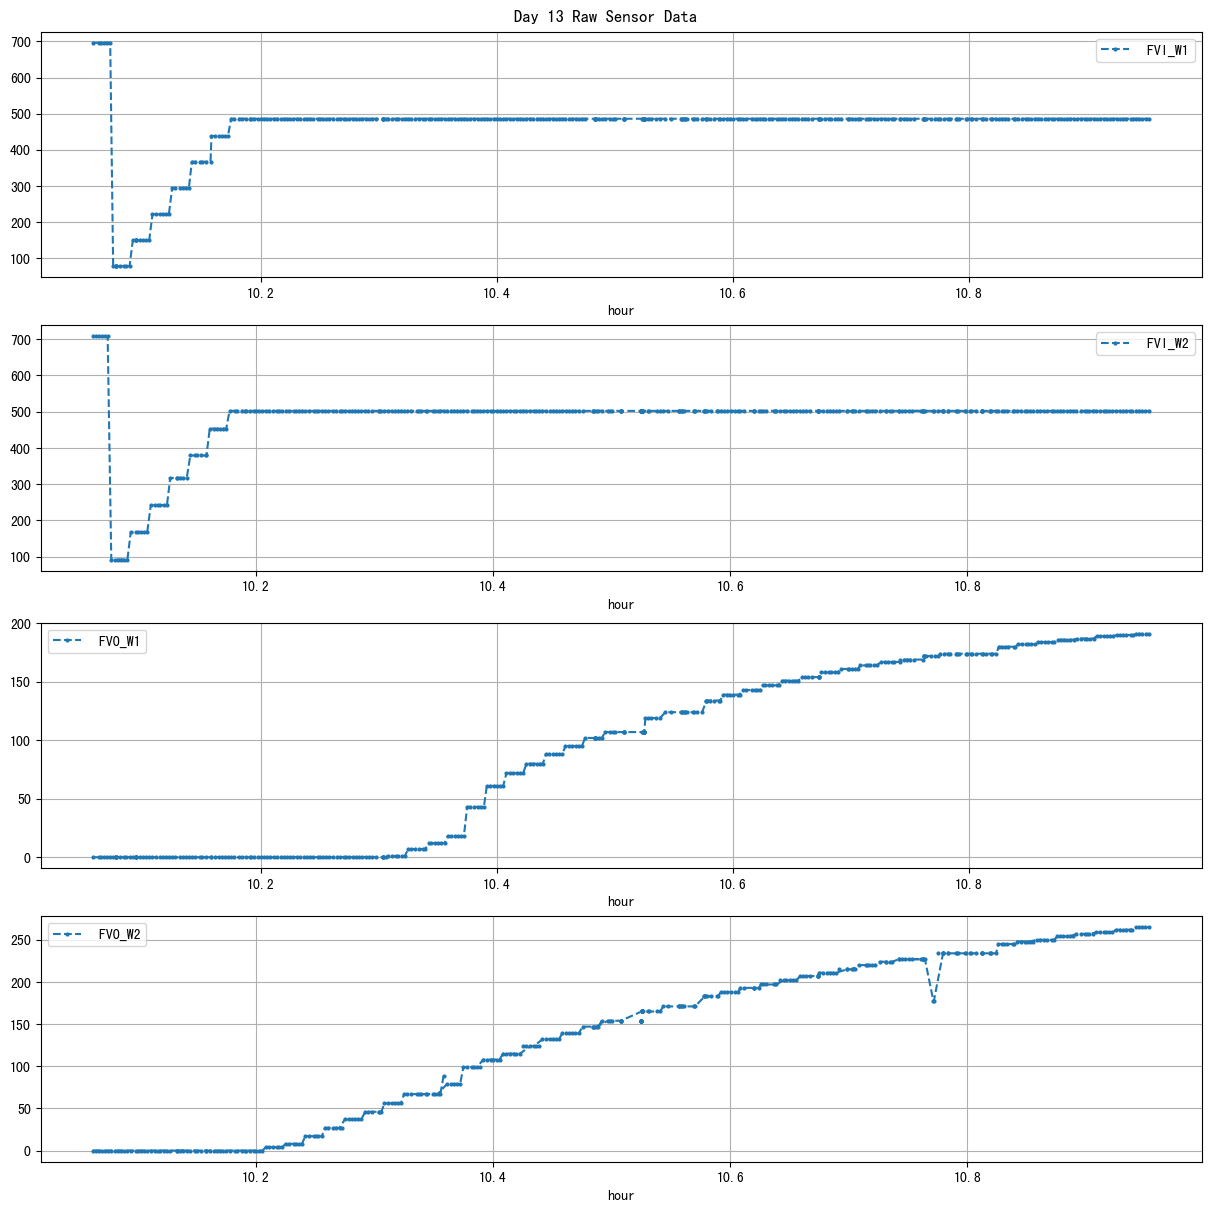
| 2026-03-14 10:02:56+08:00 | 13 | 602 | Ws_W1 | 0.820506 | 60 | 602.93 | 602.166667 | 609.95 | 610.0 | 17740.0 | 18220.0 | 421 | -0.003745 | -0.555494 | -0.159259 | 1.1602 | 1.140143 | 480.0 | True | -45.8 | 3.0 | 480.0 | 0.0 | 249.520261 | 249.520261 | 2454 | 427 | -0.917976 | 17970.479739 | 486.0 | 191.0 | NaN | NaN |
| ws_name | num_dp | num_nan_raw | num_nan_final | num_spike | cum_step_adj |
|---|---|---|---|---|---|
| Ws_W2 | 17,268 | 15,776 | 0 | 0 | 0.00 |
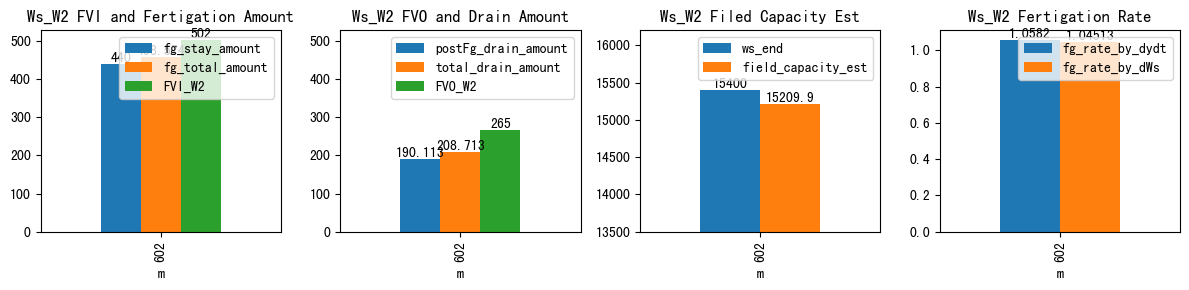
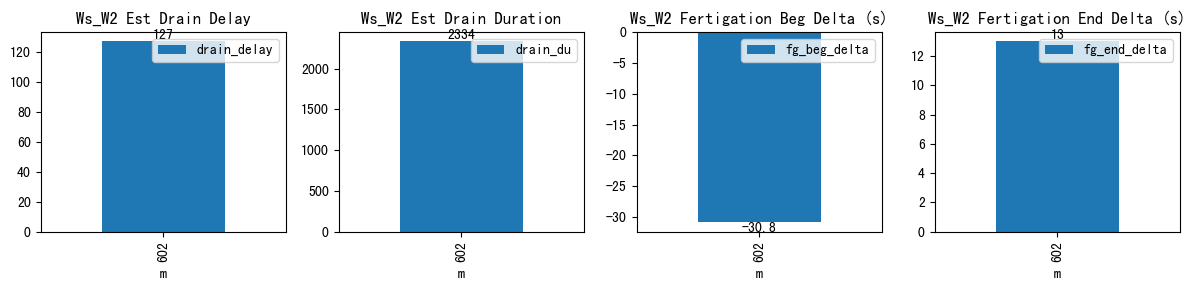
| ds | d | m | ws_name | prominence_cut | max_drain_du | fg_beg | fg_beg_est | fg_end | fg_end_est | ws_beg | ws_end | duc | pre_fg_et | post_fg_ws | post_drn_et | fg_rate_by_dydt | fg_rate_by_dWs | fg_stay_amount | enough_data | fg_beg_delta | fg_end_delta | fg_total_amount | fg_drain_amount | postFg_drain_amount | total_drain_amount | drain_du | drain_delay | drain_rate | field_capacity_est | FVI_W1 | FVO_W1 | FVI_W2 | FVO_W2 |
|---|---|---|---|---|---|---|---|---|---|---|---|---|---|---|---|---|---|---|---|---|---|---|---|---|---|---|---|---|---|---|---|---|---|
| 2026-03-14 10:02:56+08:00 | 13 | 602 | Ws_W2 | 0.935752 | 60 | 602.93 | 602.416667 | 609.95 | 610.166667 | 14960.0 | 15400.0 | 421 | 0.0 | -0.714352 | -0.179012 | 1.0582 | 1.045131 | 440.0 | True | -30.8 | 13.0 | 458.57425 | 18.6 | 190.112656 | 208.712656 | 2334 | 127 | -0.763163 | 15209.887344 | NaN | NaN | 502.0 | 265.0 |