VI and VO Daily Summary
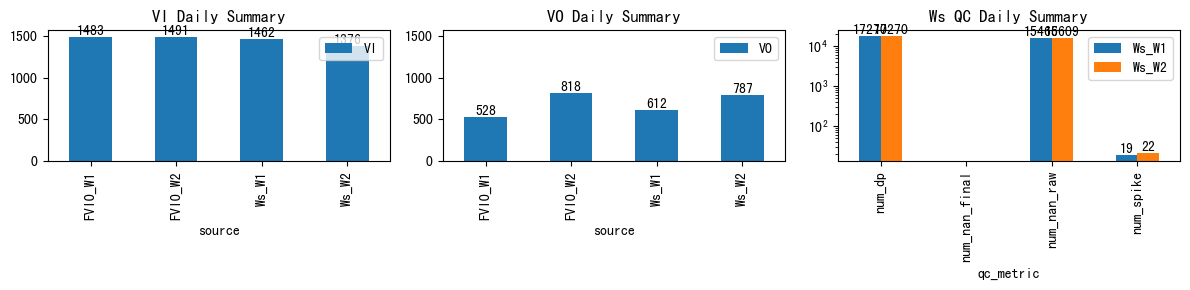
| ws_name | num_dp | num_nan_raw | num_nan_final | num_spike | cum_step_adj |
|---|---|---|---|---|---|
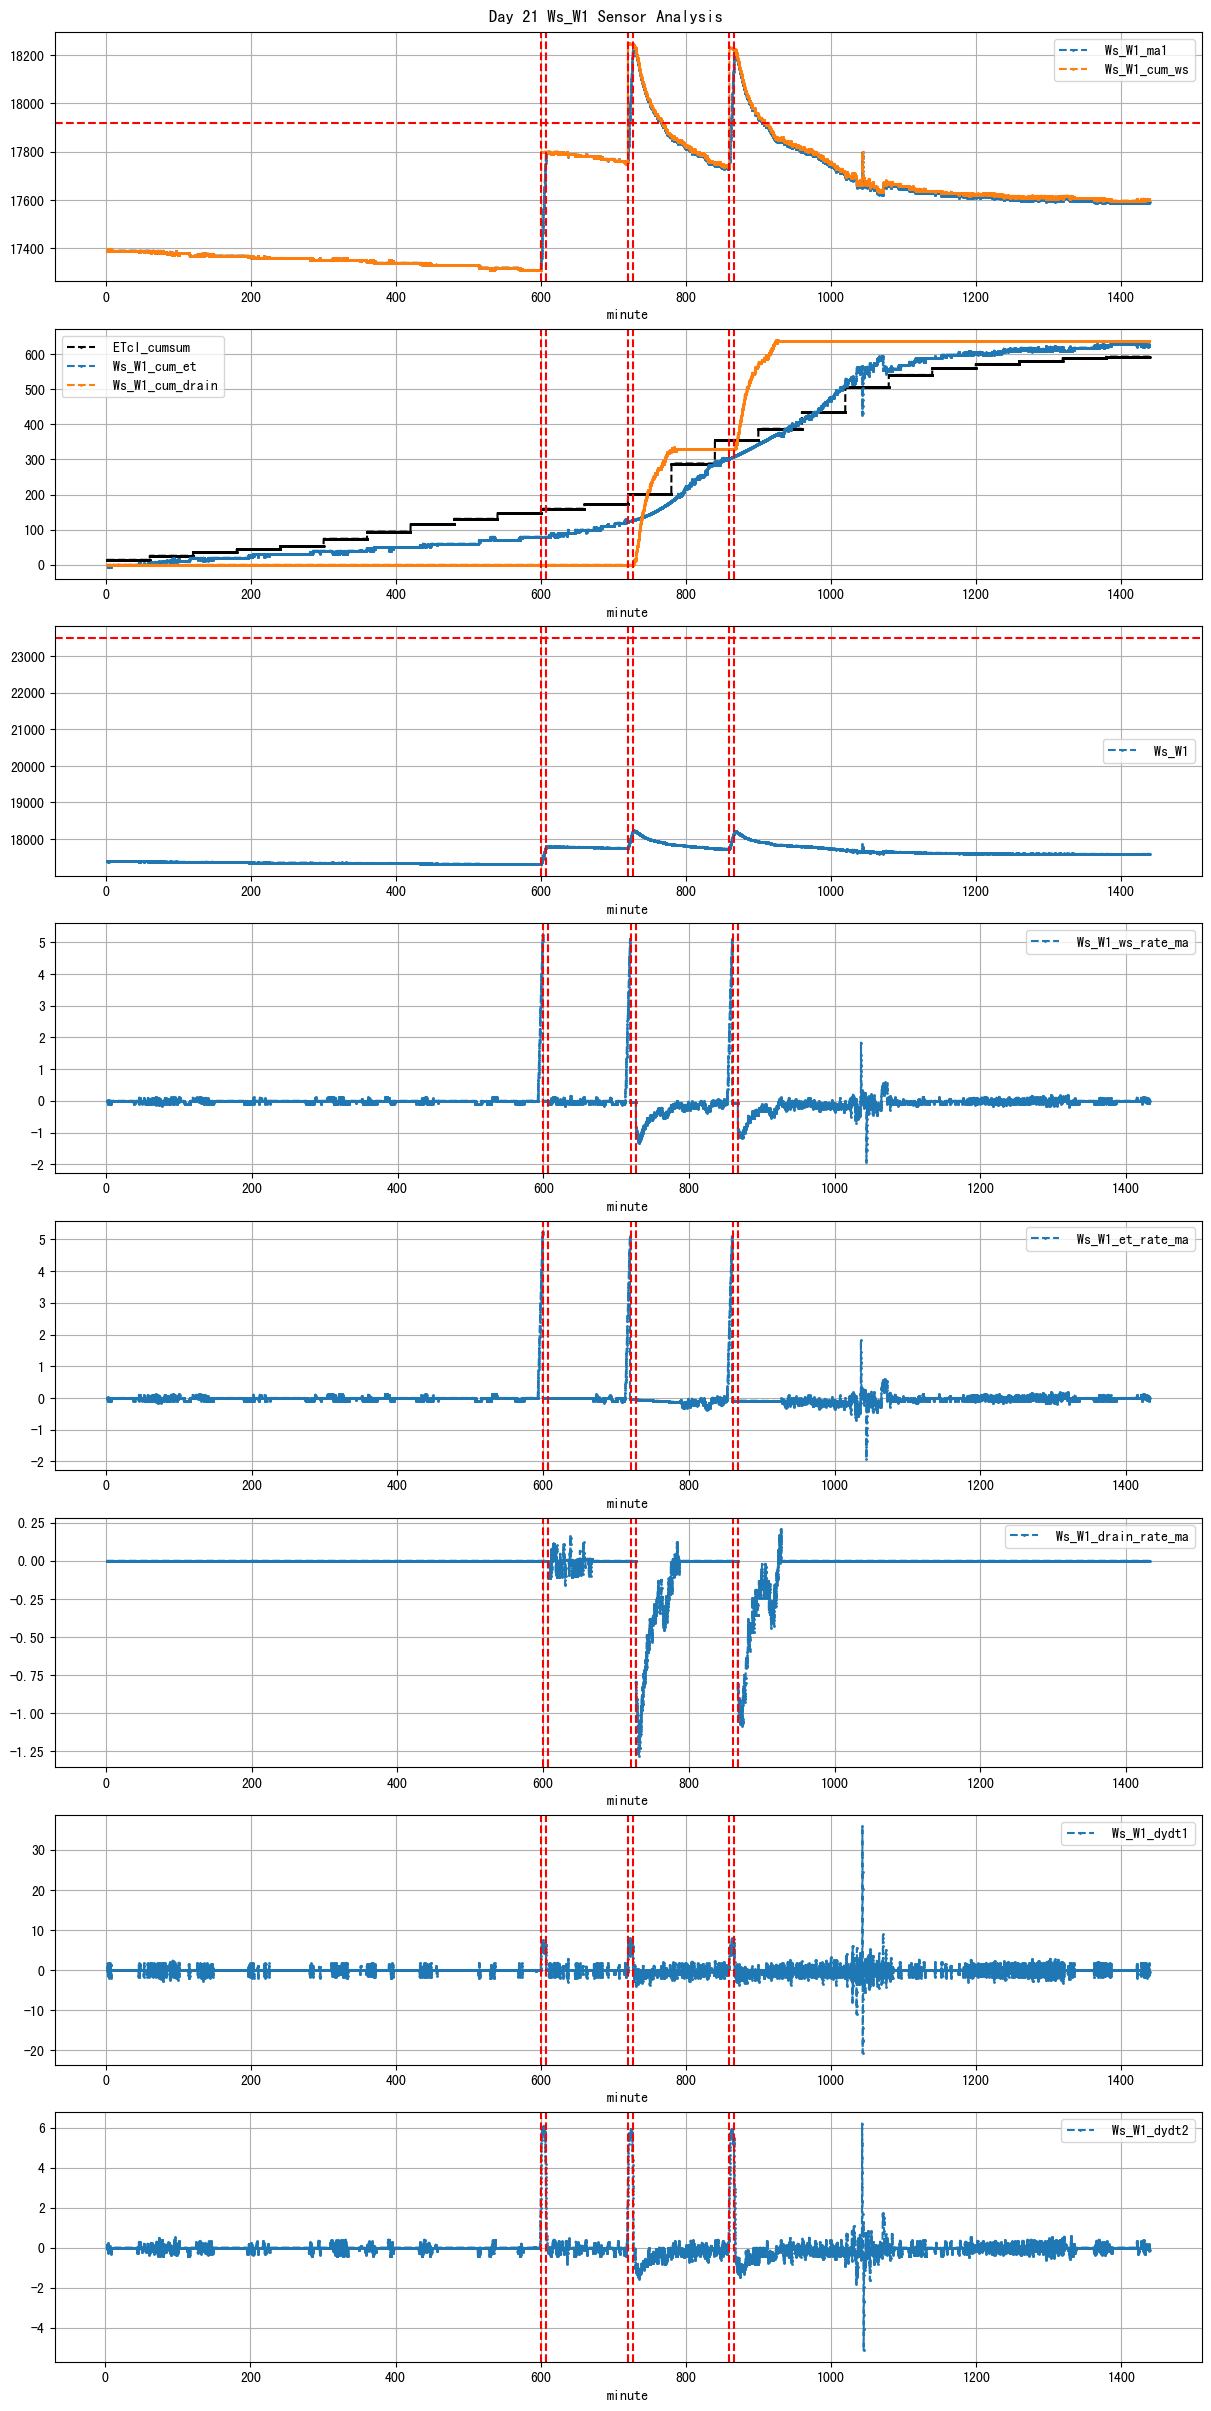
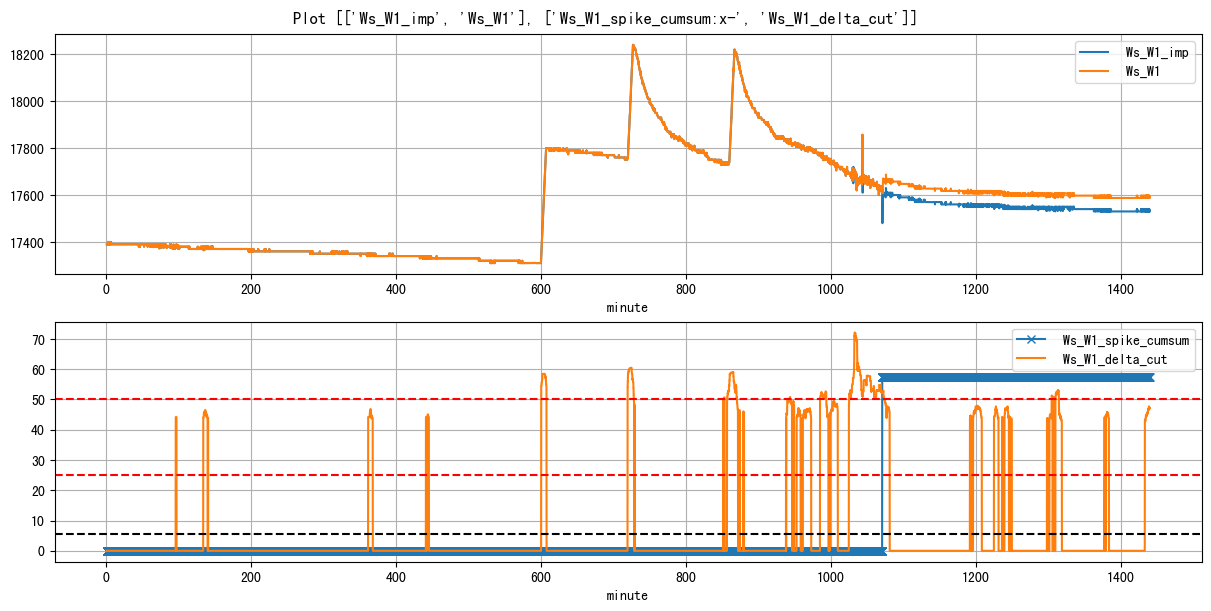
| Ws_W1 | 17,270 | 15,466 | 0 | 19 | 57.33 |
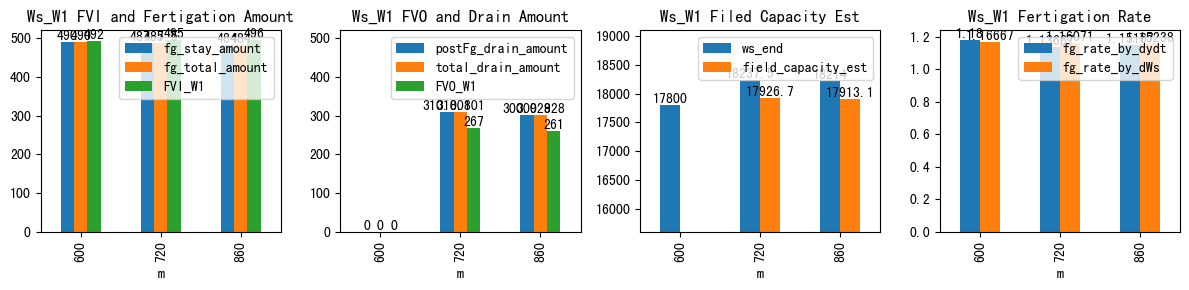
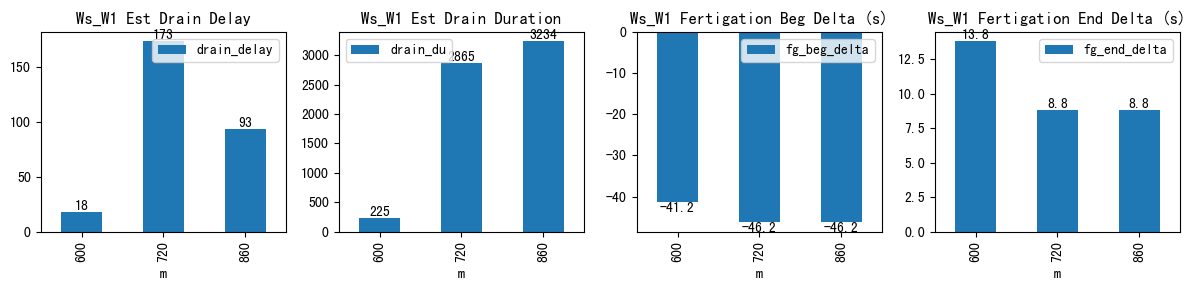
| ds | d | m | ws_name | prominence_cut | max_drain_du | fg_beg | fg_beg_est | fg_end | fg_end_est | ws_beg | ws_end | duc | pre_fg_et | post_fg_ws | post_drn_et | fg_rate_by_dydt | fg_rate_by_dWs | fg_stay_amount | enough_data | fg_beg_delta | fg_end_delta | fg_total_amount | fg_drain_amount | postFg_drain_amount | total_drain_amount | drain_du | drain_delay | drain_rate | field_capacity_est | FVI_W1 | FVO_W1 | FVI_W2 | FVO_W2 |
|---|---|---|---|---|---|---|---|---|---|---|---|---|---|---|---|---|---|---|---|---|---|---|---|---|---|---|---|---|---|---|---|---|---|
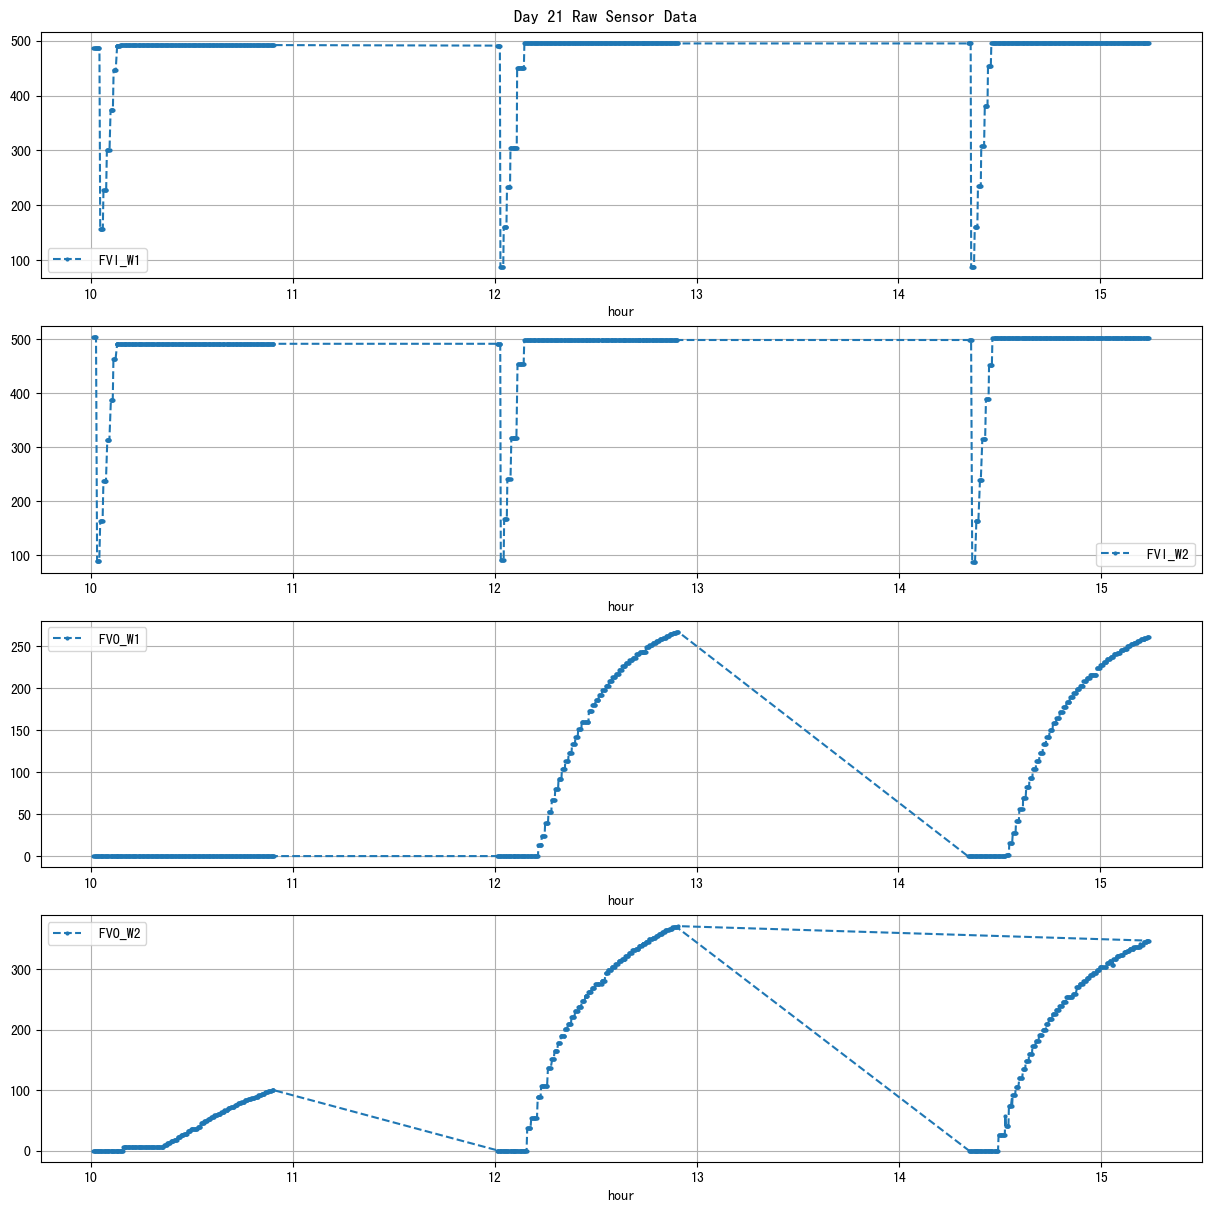
| 2026-03-22 10:00:01+08:00 | 21 | 600 | Ws_W1 | 1.181384 | 60 | 600.02 | 599.333333 | 607.02 | 607.250000 | 17310.0 | 17800.0 | 420 | 0.000000 | -0.026102 | -0.014815 | 1.180000 | 1.166667 | 490.0 | True | -41.2 | 13.8 | 490.0 | 0.0 | 0.000000 | 0.000000 | 225 | 18 | -0.110828 | NaN | 492.0 | 0.0 | NaN | NaN |
| 2026-03-22 12:00:01+08:00 | 21 | 720 | Ws_W1 | 1.181384 | 60 | 720.02 | 719.250000 | 727.02 | 727.166667 | 17750.0 | 18237.5 | 420 | -0.046712 | -1.103164 | -0.133128 | 1.136667 | 1.160714 | 487.5 | True | -46.2 | 8.8 | 487.5 | 0.0 | 310.800986 | 310.800986 | 2865 | 173 | -1.083030 | 17926.699014 | 495.0 | 267.0 | NaN | NaN |
| 2026-03-22 14:20:01+08:00 | 21 | 860 | Ws_W1 | 1.181384 | 60 | 860.02 | 859.250000 | 867.02 | 867.166667 | 17730.0 | 18214.0 | 420 | -0.083362 | -1.047942 | -0.096571 | 1.151667 | 1.152381 | 484.0 | True | -46.2 | 8.8 | 484.0 | 0.0 | 300.928105 | 300.928105 | 3234 | 93 | -0.980996 | 17913.071895 | 496.0 | 261.0 | NaN | NaN |
| ws_name | num_dp | num_nan_raw | num_nan_final | num_spike | cum_step_adj |
|---|---|---|---|---|---|
| Ws_W2 | 17,270 | 15,609 | 0 | 22 | 0.00 |
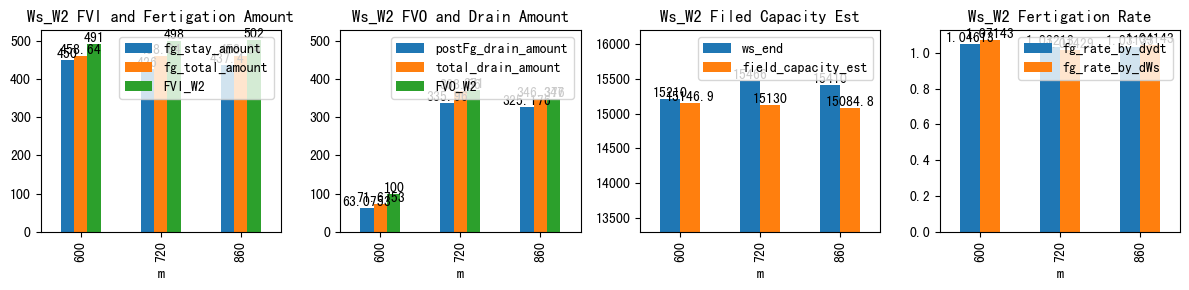
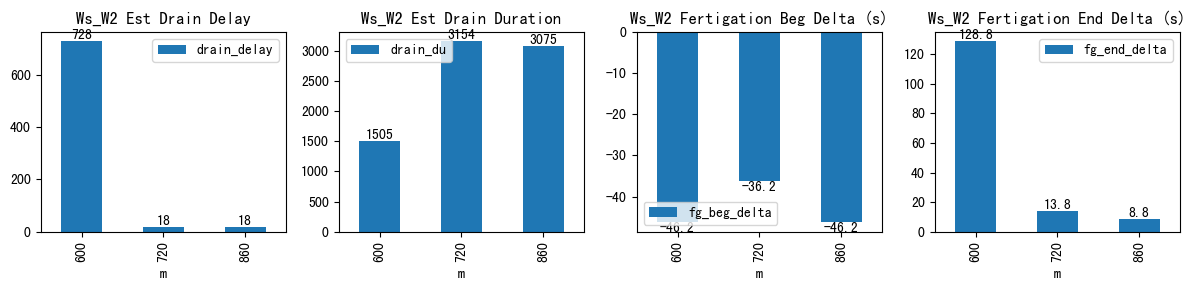
| ds | d | m | ws_name | prominence_cut | max_drain_du | fg_beg | fg_beg_est | fg_end | fg_end_est | ws_beg | ws_end | duc | pre_fg_et | post_fg_ws | post_drn_et | fg_rate_by_dydt | fg_rate_by_dWs | fg_stay_amount | enough_data | fg_beg_delta | fg_end_delta | fg_total_amount | fg_drain_amount | postFg_drain_amount | total_drain_amount | drain_du | drain_delay | drain_rate | field_capacity_est | FVI_W1 | FVO_W1 | FVI_W2 | FVO_W2 |
|---|---|---|---|---|---|---|---|---|---|---|---|---|---|---|---|---|---|---|---|---|---|---|---|---|---|---|---|---|---|---|---|---|---|
| 2026-03-22 10:00:01+08:00 | 21 | 600 | Ws_W2 | 1.111671 | 60 | 600.02 | 599.250000 | 607.02 | 609.166667 | 14760.0 | 15210.0 | 420 | 0.000000 | -0.050000 | -0.148962 | 1.046133 | 1.071429 | 450.0 | True | -46.2 | 128.8 | 458.64 | 8.6 | 63.075324 | 71.675324 | 1505 | 728 | -0.293617 | 15146.924676 | NaN | NaN | 491.0 | 100.0 |
| 2026-03-22 12:00:01+08:00 | 21 | 720 | Ws_W2 | 1.111671 | 60 | 720.02 | 719.416667 | 727.02 | 727.250000 | 15040.0 | 15466.0 | 420 | -0.060549 | -1.160684 | -0.114550 | 1.032133 | 1.014286 | 426.0 | True | -36.2 | 13.8 | 458.64 | 32.6 | 335.959604 | 368.559604 | 3154 | 18 | -1.157970 | 15130.040396 | NaN | NaN | 498.0 | 371.0 |
| 2026-03-22 14:20:01+08:00 | 21 | 860 | Ws_W2 | 1.111671 | 60 | 860.02 | 859.250000 | 867.02 | 867.166667 | 14972.6 | 15410.0 | 420 | 0.000000 | -1.038496 | -0.079012 | 1.031333 | 1.041429 | 437.4 | True | -46.2 | 8.8 | 458.64 | 21.2 | 325.176144 | 346.376144 | 3075 | 18 | -1.101867 | 15084.823856 | NaN | NaN | 502.0 | 347.0 |