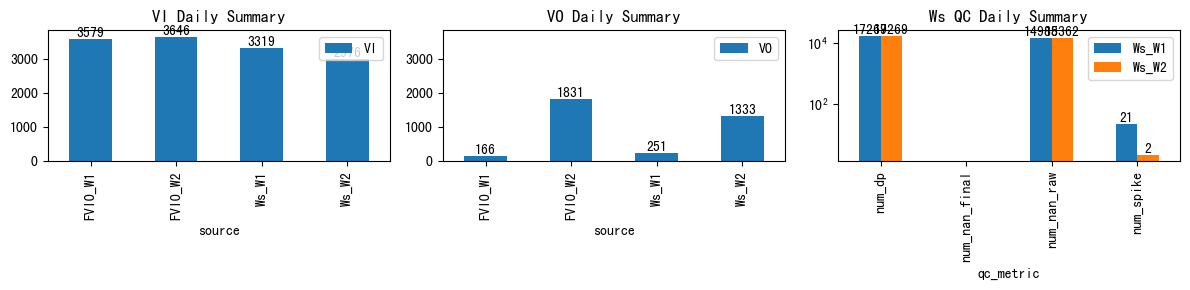
VI and VO Daily Summary
| ws_name | num_dp | num_nan_raw | num_nan_final | num_spike | cum_step_adj |
|---|---|---|---|---|---|
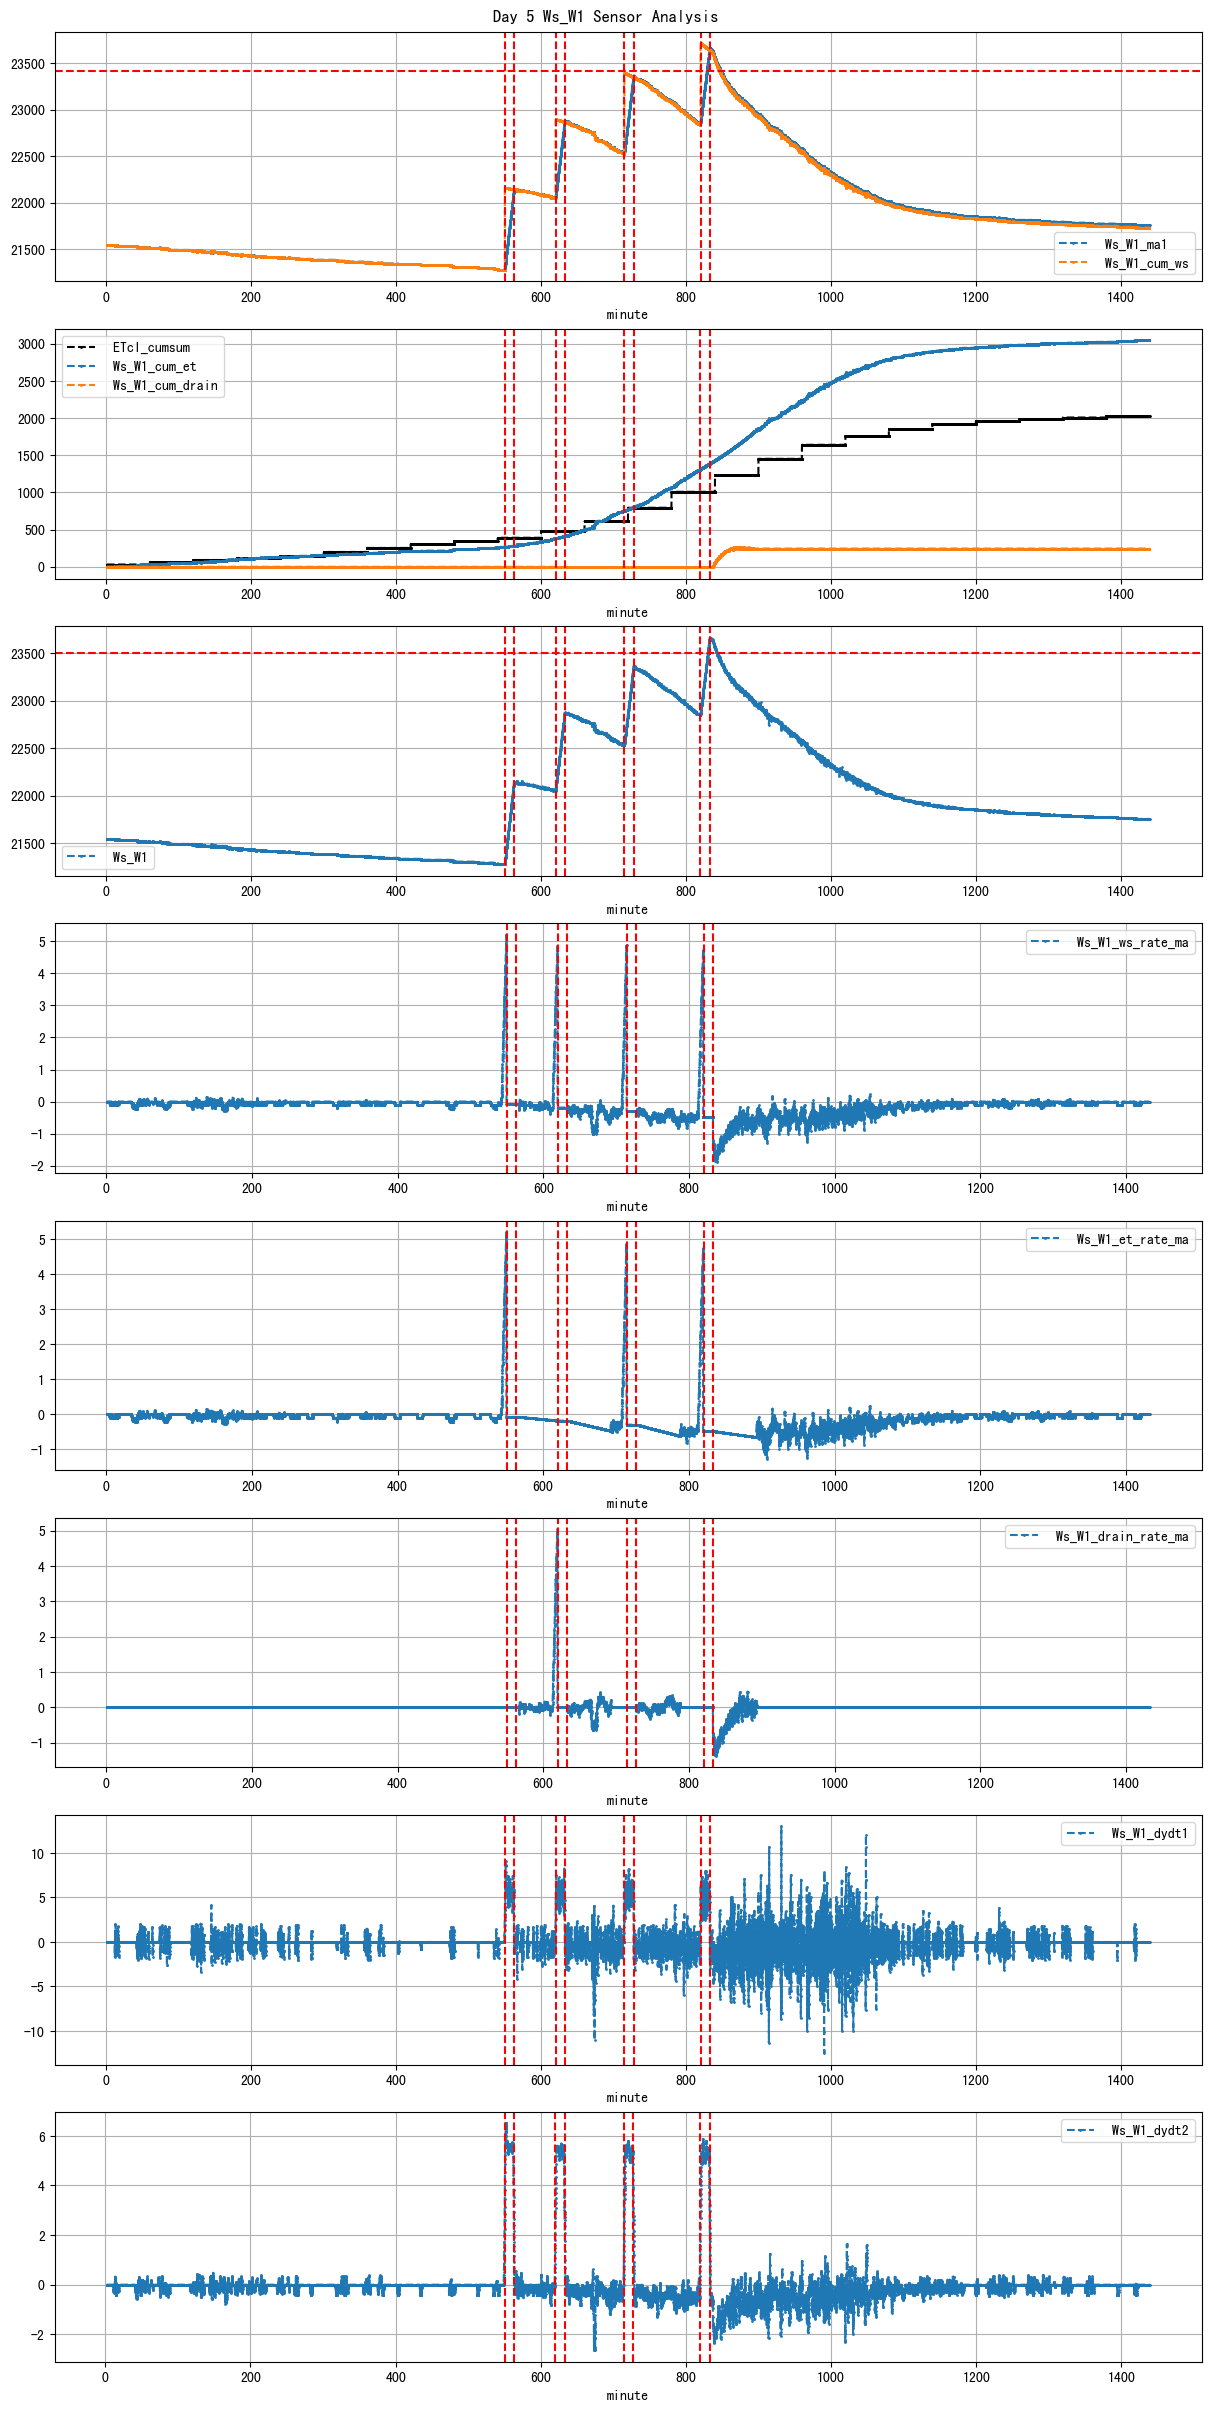
| Ws_W1 | 17,269 | 14,988 | 0 | 21 | -16.38 |
| ds | d | m | ws_name | prominence_cut | max_drain_du | fg_beg | fg_beg_est | fg_end | fg_end_est | ws_beg | ws_end | duc | pre_fg_et | post_fg_ws | post_drn_et | fg_rate_by_dydt | fg_rate_by_dWs | fg_stay_amount | enough_data | fg_beg_delta | fg_end_delta | fg_total_amount | fg_drain_amount | postFg_drain_amount | total_drain_amount | drain_du | drain_delay | drain_rate | field_capacity_est | FVI_W1 | FVO_W1 | FVI_W2 | FVO_W2 |
|---|---|---|---|---|---|---|---|---|---|---|---|---|---|---|---|---|---|---|---|---|---|---|---|---|---|---|---|---|---|---|---|---|---|
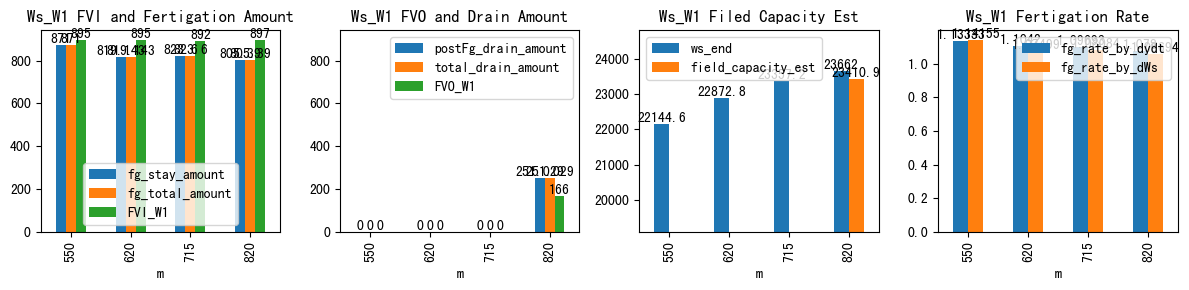
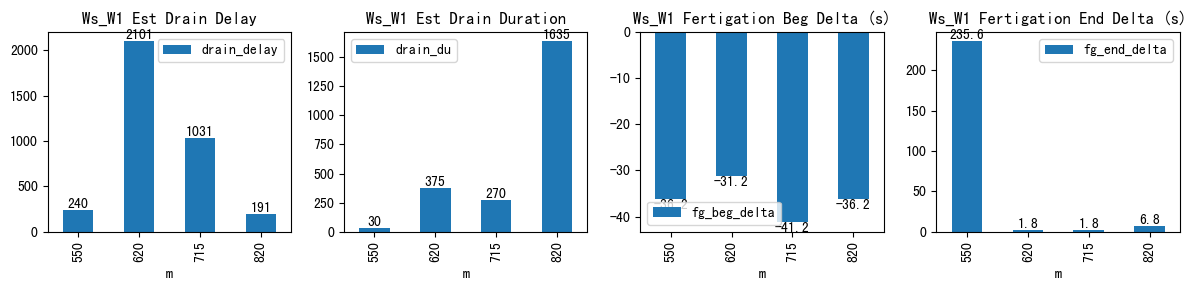
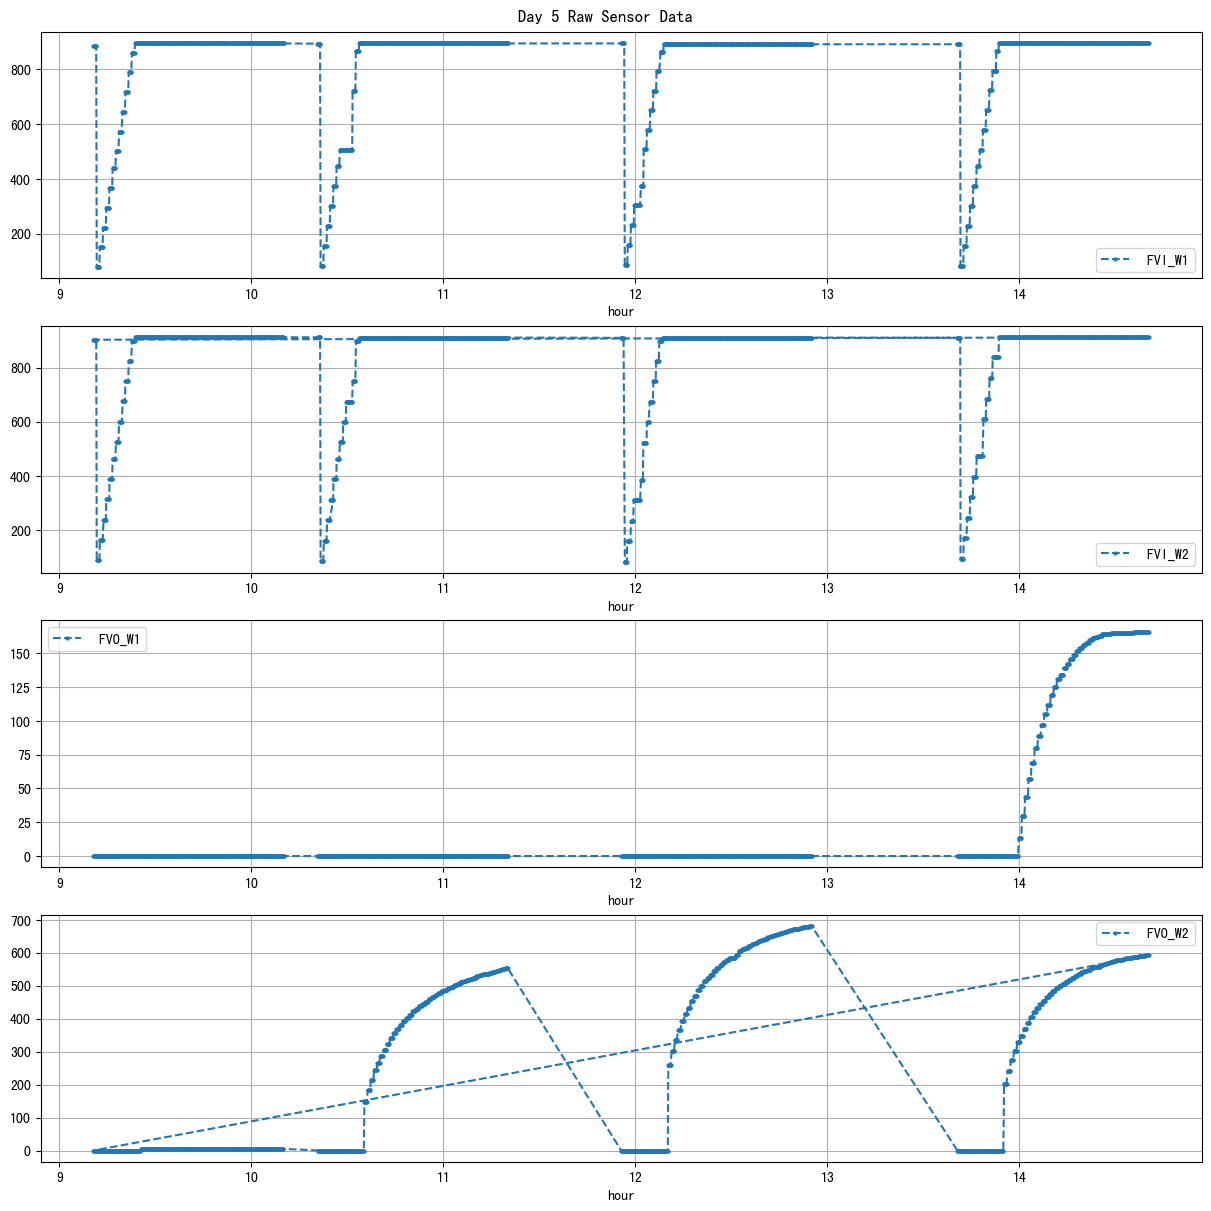
| 2026-03-06 09:10:01+08:00 | 5 | 550 | Ws_W1 | 1.69845 | 53.333333 | 550.02 | 549.416667 | 562.74 | 566.666667 | 21273.619048 | 22144.619048 | 763 | -0.103620 | -0.082510 | 0.000000 | 1.133333 | 1.141547 | 871.000000 | True | -36.2 | 235.6 | 871.000000 | 0.0 | 0.000000 | 0.000000 | 30 | 240 | -0.097618 | NaN | 895.0 | 0.0 | NaN | NaN |
| 2026-03-06 10:20:01+08:00 | 5 | 620 | Ws_W1 | 1.69845 | 60.000000 | 620.02 | 619.500000 | 632.72 | 632.750000 | 22053.619048 | 22872.761905 | 762 | -0.189195 | -0.266049 | -0.479316 | 1.104200 | 1.074991 | 819.142857 | True | -31.2 | 1.8 | 819.142857 | 0.0 | 0.000000 | 0.000000 | 375 | 2101 | -0.574365 | NaN | 895.0 | 0.0 | NaN | NaN |
| 2026-03-06 11:55:01+08:00 | 5 | 715 | Ws_W1 | 1.69845 | 60.000000 | 715.02 | 714.333333 | 727.72 | 727.750000 | 22533.619048 | 23357.219048 | 762 | -0.305119 | -0.303395 | -0.626250 | 1.096933 | 1.080840 | 823.600000 | True | -41.2 | 1.8 | 823.600000 | 0.0 | 0.000000 | 0.000000 | 270 | 1031 | -0.219681 | NaN | 892.0 | 0.0 | NaN | NaN |
| 2026-03-06 13:40:01+08:00 | 5 | 820 | Ws_W1 | 1.69845 | 60.000000 | 820.02 | 819.416667 | 832.72 | 832.833333 | 22856.561905 | 23661.952381 | 762 | -0.487370 | -1.594444 | -0.663045 | 1.078000 | 1.056943 | 805.390476 | True | -36.2 | 6.8 | 805.390476 | 0.0 | 251.028895 | 251.028895 | 1635 | 191 | -1.216666 | 23410.923485 | 897.0 | 166.0 | NaN | NaN |
| ws_name | num_dp | num_nan_raw | num_nan_final | num_spike | cum_step_adj |
|---|---|---|---|---|---|
| Ws_W2 | 17,269 | 15,362 | 0 | 2 | 0.00 |
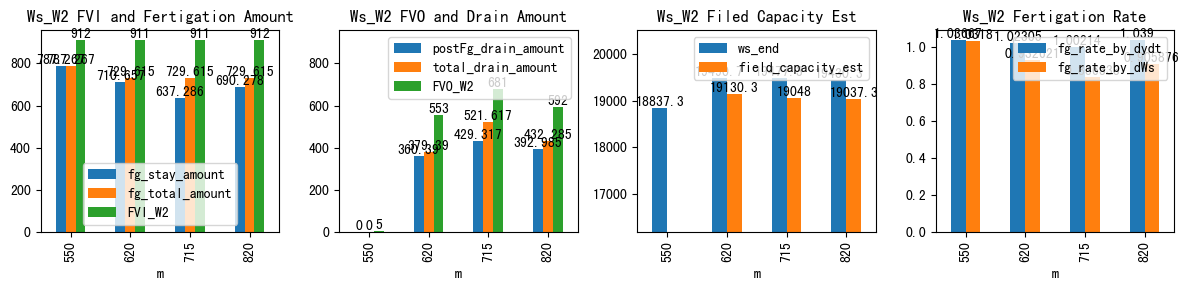
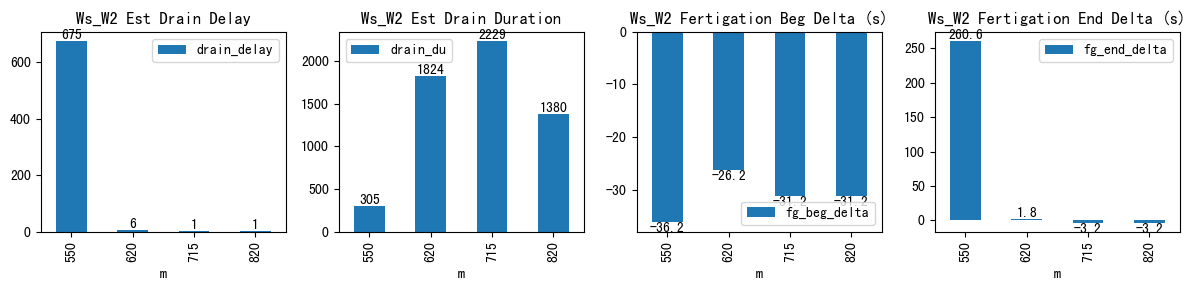
| ds | d | m | ws_name | prominence_cut | max_drain_du | fg_beg | fg_beg_est | fg_end | fg_end_est | ws_beg | ws_end | duc | pre_fg_et | post_fg_ws | post_drn_et | fg_rate_by_dydt | fg_rate_by_dWs | fg_stay_amount | enough_data | fg_beg_delta | fg_end_delta | fg_total_amount | fg_drain_amount | postFg_drain_amount | total_drain_amount | drain_du | drain_delay | drain_rate | field_capacity_est | FVI_W1 | FVO_W1 | FVI_W2 | FVO_W2 |
|---|---|---|---|---|---|---|---|---|---|---|---|---|---|---|---|---|---|---|---|---|---|---|---|---|---|---|---|---|---|---|---|---|---|
| 2026-03-06 09:10:01+08:00 | 5 | 550 | Ws_W2 | 2.145971 | 52.916667 | 550.02 | 549.416667 | 562.74 | 567.083333 | 18050.0 | 18837.266667 | 763 | -0.089263 | -0.056296 | 0.000000 | 1.036667 | 1.031804 | 787.266667 | True | -36.2 | 260.6 | 787.266667 | 0.0 | 0.000000 | 0.000000 | 305 | 675 | -0.092341 | NaN | NaN | NaN | 912.0 | 5.0 |
| 2026-03-06 10:20:01+08:00 | 5 | 620 | Ws_W2 | 2.145971 | 60.000000 | 620.02 | 619.583333 | 632.72 | 632.750000 | 18780.0 | 19490.657143 | 762 | -0.142265 | -1.722254 | -0.319959 | 1.023048 | 0.932621 | 710.657143 | True | -26.2 | 1.8 | 729.615000 | 19.0 | 360.389870 | 379.389870 | 1824 | 6 | -1.694294 | 19130.267273 | NaN | NaN | 911.0 | 553.0 |
| 2026-03-06 11:55:01+08:00 | 5 | 715 | Ws_W2 | 2.145971 | 60.000000 | 715.02 | 714.500000 | 727.72 | 727.666667 | 18840.0 | 19477.285714 | 762 | -0.197253 | -1.856242 | -0.407407 | 1.002143 | 0.836333 | 637.285714 | True | -31.2 | -3.2 | 729.615000 | 92.3 | 429.316588 | 521.616588 | 2229 | 1 | -1.906652 | 19047.969126 | NaN | NaN | 911.0 | 681.0 |
| 2026-03-06 13:40:01+08:00 | 5 | 820 | Ws_W2 | 2.145971 | 60.000000 | 820.02 | 819.500000 | 832.72 | 832.666667 | 18740.0 | 19430.277778 | 762 | -0.214061 | -2.049492 | -0.479100 | 1.039000 | 0.905876 | 690.277778 | True | -31.2 | -3.2 | 729.615000 | 39.3 | 392.984664 | 432.284664 | 1380 | 1 | -2.158278 | 19037.293114 | NaN | NaN | 912.0 | 592.0 |