VI and VO Daily Summary
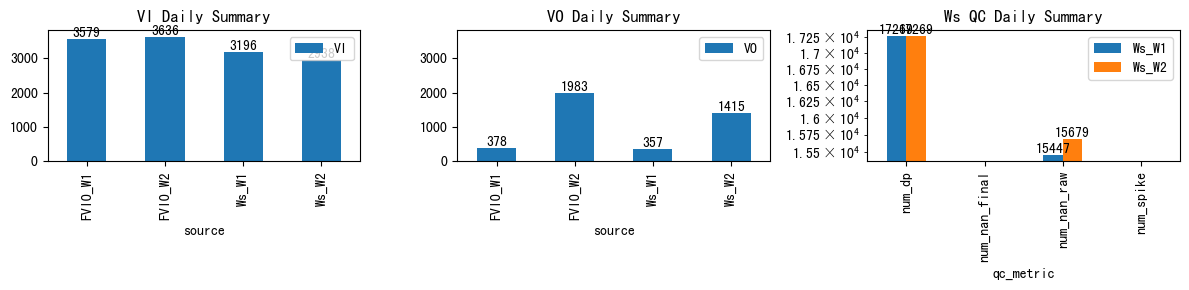
| ws_name | num_dp | num_nan_raw | num_nan_final | num_spike | cum_step_adj |
|---|---|---|---|---|---|
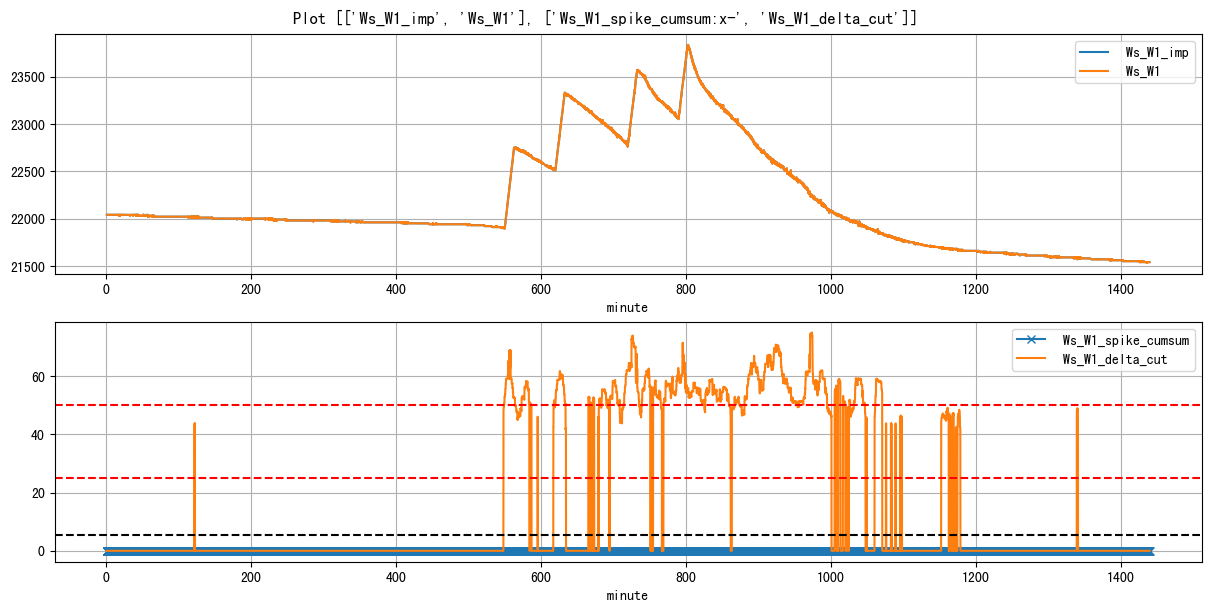
| Ws_W1 | 17,269 | 15,447 | 0 | 0 | 0.00 |
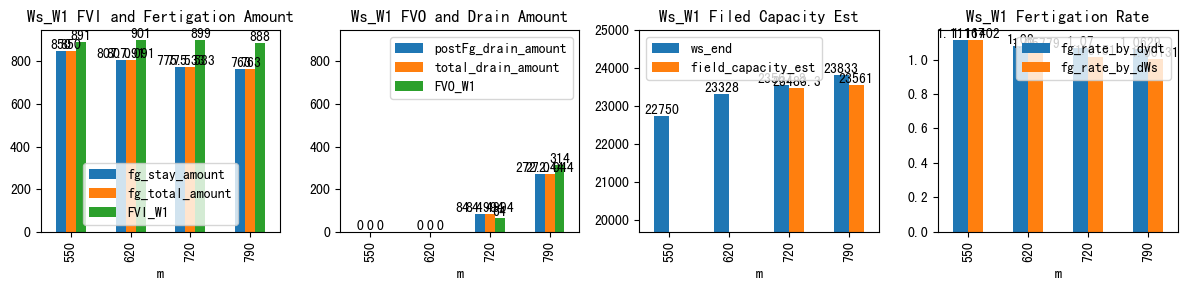
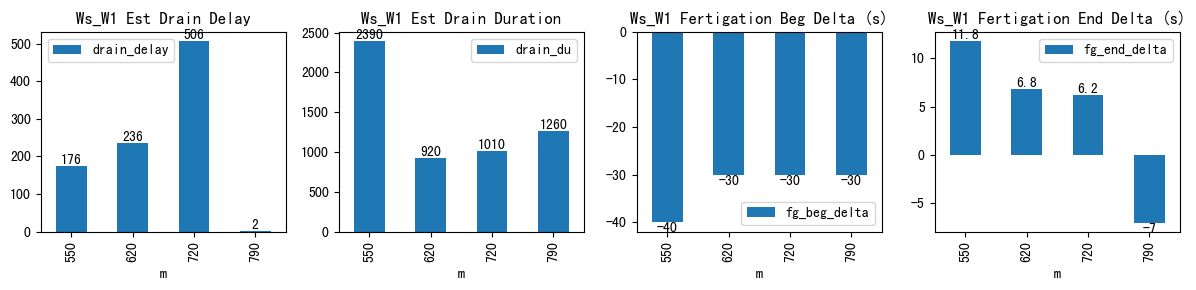
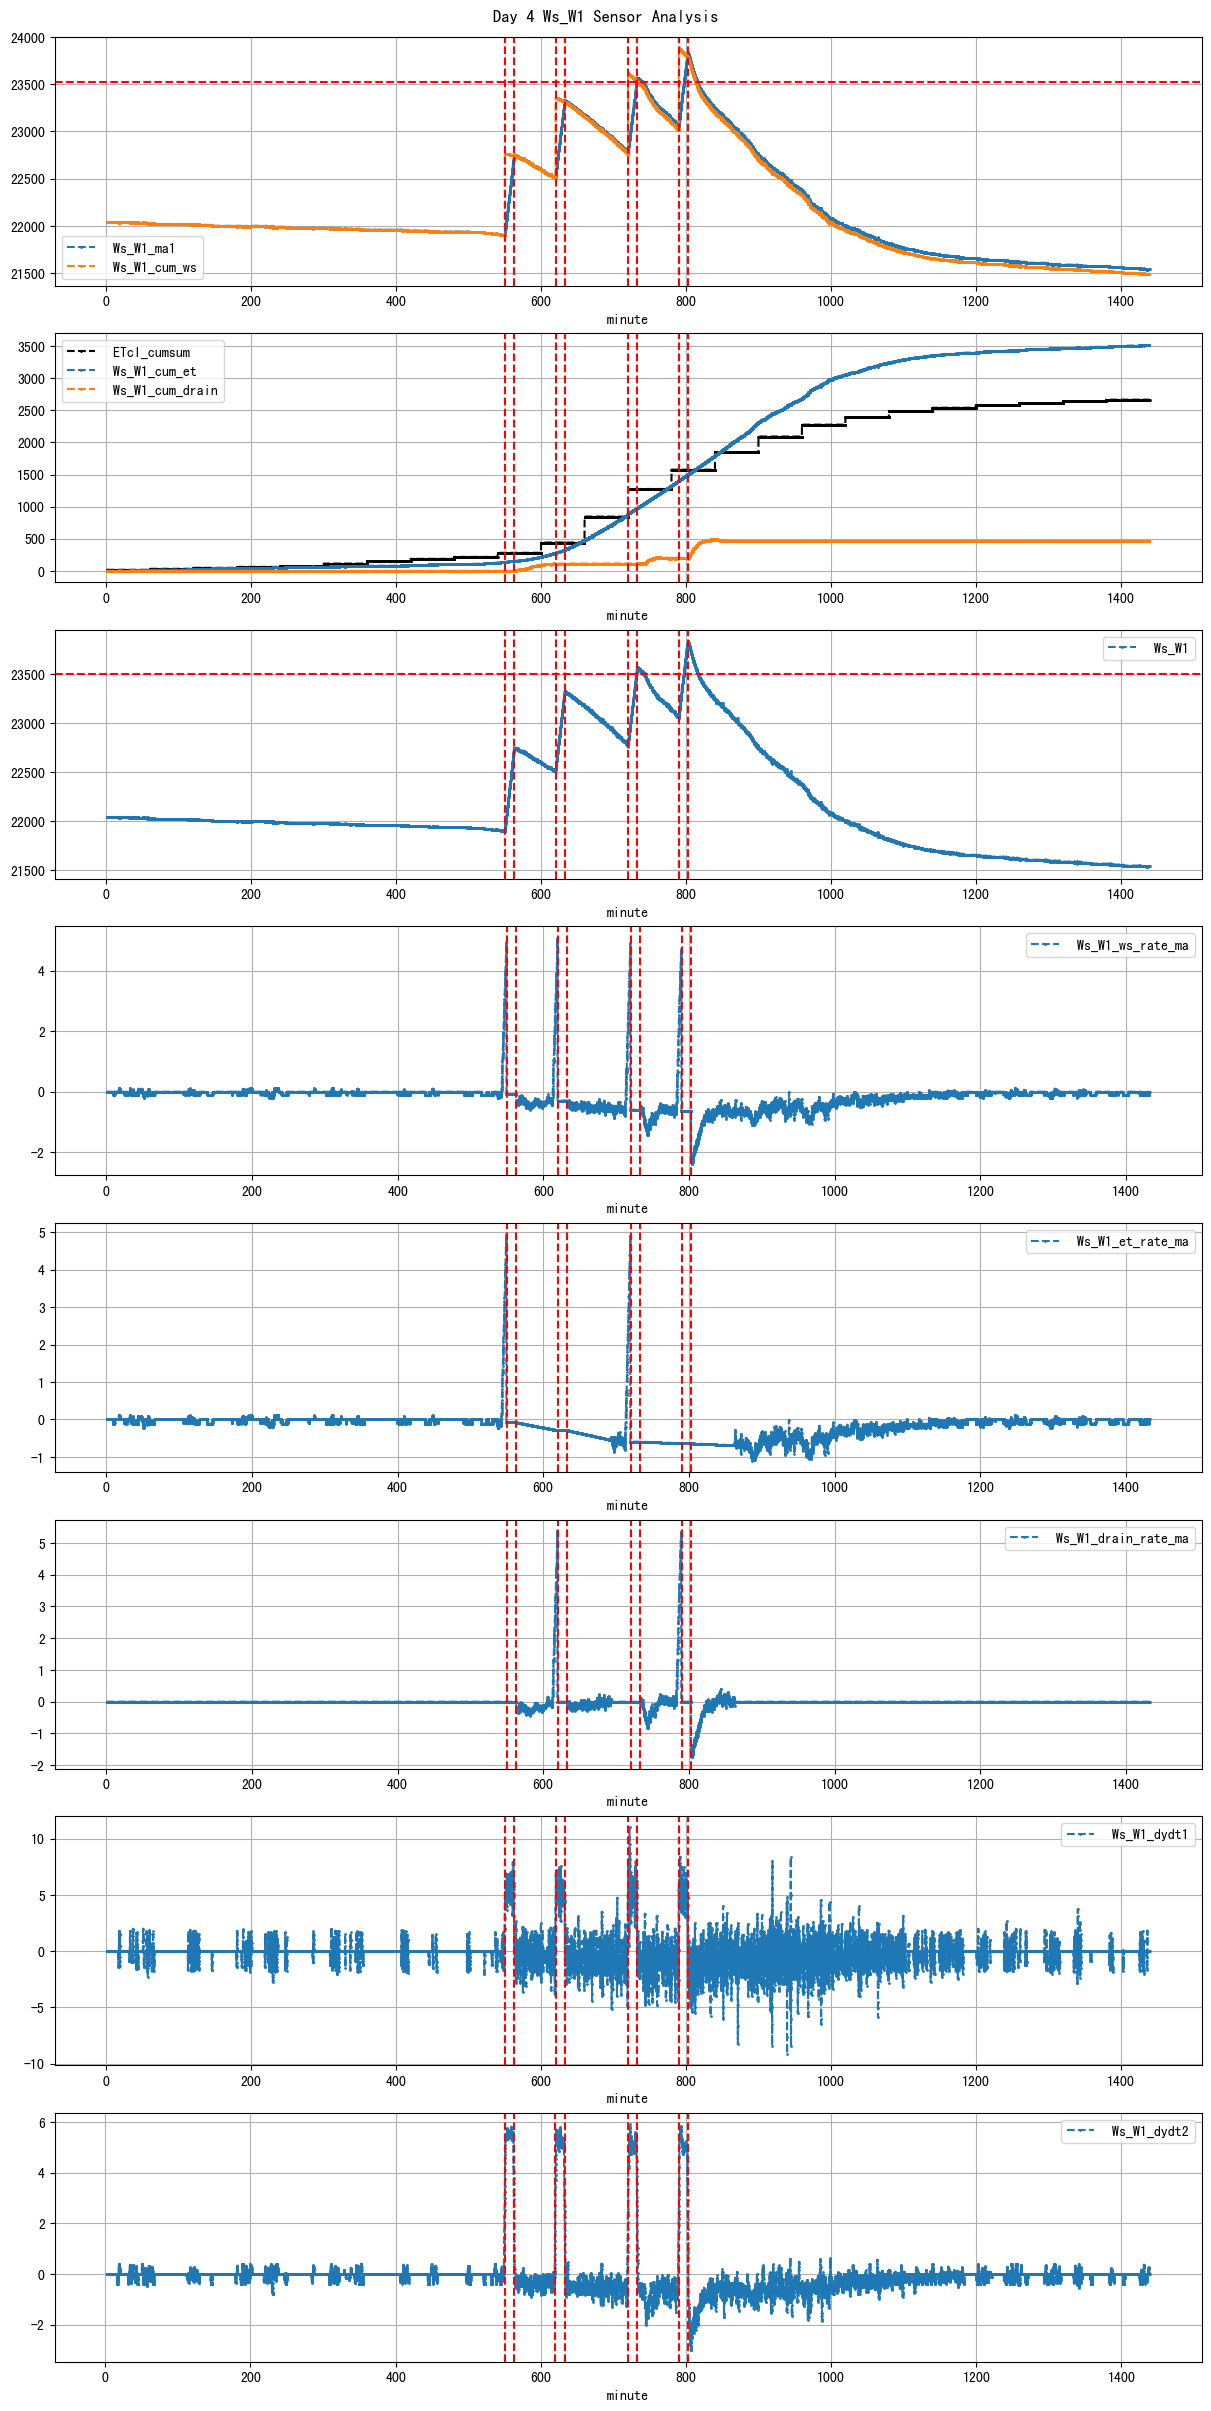
| ds | d | m | ws_name | prominence_cut | max_drain_du | fg_beg | fg_beg_est | fg_end | fg_end_est | ws_beg | ws_end | duc | pre_fg_et | post_fg_ws | post_drn_et | fg_rate_by_dydt | fg_rate_by_dWs | fg_stay_amount | enough_data | fg_beg_delta | fg_end_delta | fg_total_amount | fg_drain_amount | postFg_drain_amount | total_drain_amount | drain_du | drain_delay | drain_rate | field_capacity_est | FVI_W1 | FVO_W1 | FVI_W2 | FVO_W2 |
|---|---|---|---|---|---|---|---|---|---|---|---|---|---|---|---|---|---|---|---|---|---|---|---|---|---|---|---|---|---|---|---|---|---|
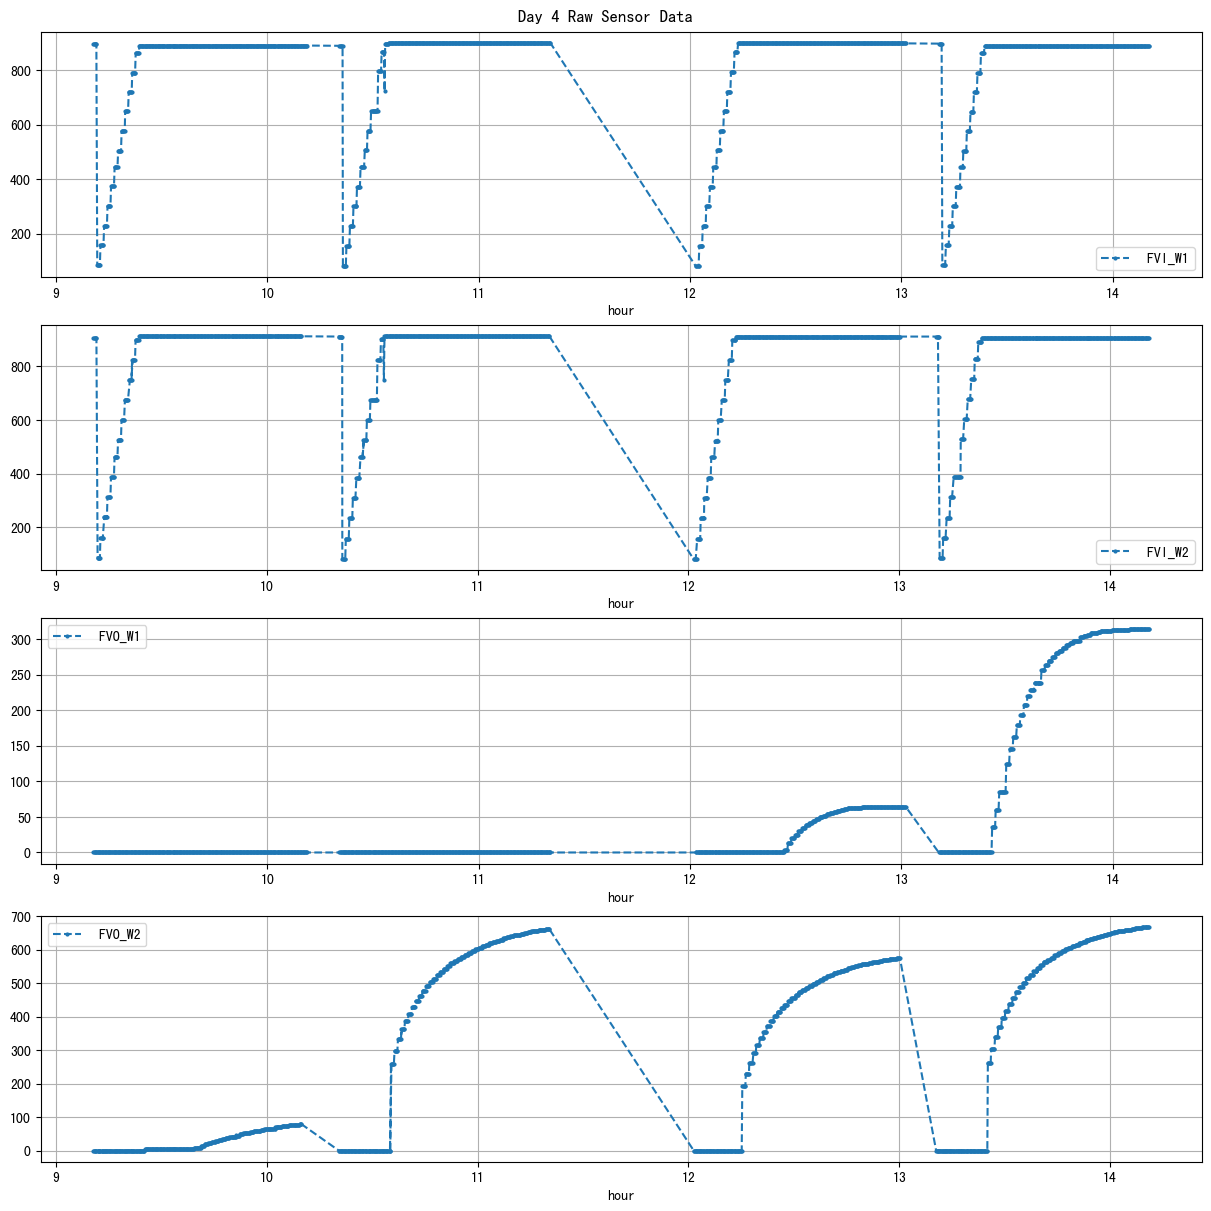
| 2026-03-05 09:10:00+08:00 | 4 | 550 | Ws_W1 | 1.831785 | 57.083333 | 550.0 | 549.333333 | 562.72 | 562.916667 | 21900.000000 | 22750.000000 | 763 | -0.080774 | -0.294547 | 0.000000 | 1.111667 | 1.114024 | 850.000000 | True | -40.0 | 11.8 | 850.000000 | 0.0 | 0.000000 | 0.000000 | 2390 | 176 | -0.347225 | NaN | 891.0 | 0.0 | NaN | NaN |
| 2026-03-05 10:20:00+08:00 | 4 | 620 | Ws_W1 | 1.831785 | 60.000000 | 620.0 | 619.500000 | 632.72 | 632.833333 | 22520.909091 | 23328.000000 | 763 | -0.291738 | -0.439198 | -0.546759 | 1.080000 | 1.057786 | 807.090909 | True | -30.0 | 6.8 | 807.090909 | 0.0 | 0.000000 | 0.000000 | 920 | 236 | -0.227479 | NaN | 901.0 | 0.0 | NaN | NaN |
| 2026-03-05 12:00:00+08:00 | 4 | 720 | Ws_W1 | 1.831785 | 57.166667 | 720.0 | 719.500000 | 732.73 | 732.833333 | 22792.300000 | 23567.833333 | 764 | -0.593623 | -0.767284 | 0.000000 | 1.070000 | 1.015096 | 775.533333 | True | -30.0 | 6.2 | 775.533333 | 0.0 | 84.499368 | 84.499368 | 1010 | 506 | -0.652333 | 23483.333965 | 899.0 | 64.0 | NaN | NaN |
| 2026-03-05 13:10:00+08:00 | 4 | 790 | Ws_W1 | 1.831785 | 60.000000 | 790.0 | 789.500000 | 802.70 | 802.583333 | 23070.000000 | 23833.000000 | 762 | -0.640762 | -2.045079 | -0.692144 | 1.062905 | 1.001312 | 763.000000 | True | -30.0 | -7.0 | 763.000000 | 0.0 | 272.044330 | 272.044330 | 1260 | 2 | -1.554320 | 23560.955670 | 888.0 | 314.0 | NaN | NaN |
| ws_name | num_dp | num_nan_raw | num_nan_final | num_spike | cum_step_adj |
|---|---|---|---|---|---|
| Ws_W2 | 17,269 | 15,679 | 0 | 0 | 0.00 |
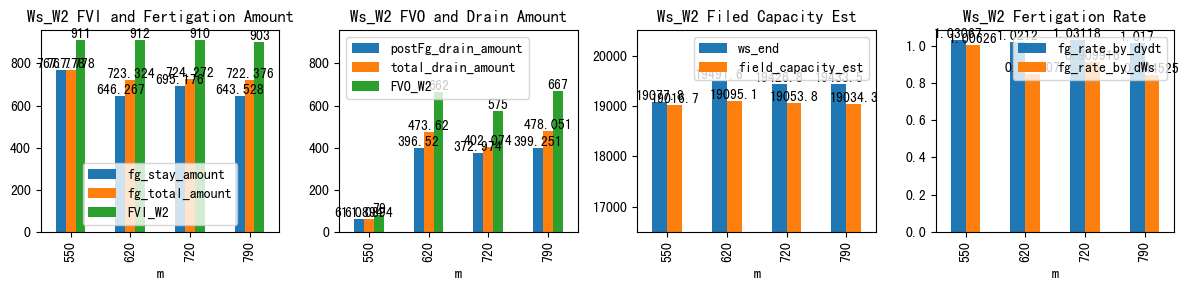
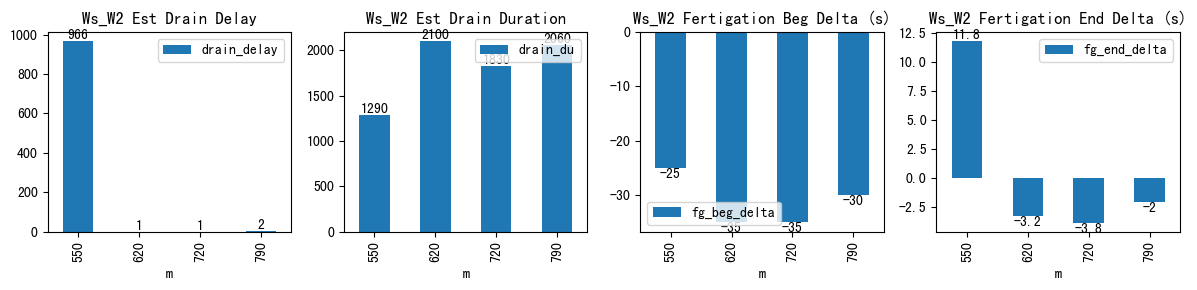
| ds | d | m | ws_name | prominence_cut | max_drain_du | fg_beg | fg_beg_est | fg_end | fg_end_est | ws_beg | ws_end | duc | pre_fg_et | post_fg_ws | post_drn_et | fg_rate_by_dydt | fg_rate_by_dWs | fg_stay_amount | enough_data | fg_beg_delta | fg_end_delta | fg_total_amount | fg_drain_amount | postFg_drain_amount | total_drain_amount | drain_du | drain_delay | drain_rate | field_capacity_est | FVI_W1 | FVO_W1 | FVI_W2 | FVO_W2 |
|---|---|---|---|---|---|---|---|---|---|---|---|---|---|---|---|---|---|---|---|---|---|---|---|---|---|---|---|---|---|---|---|---|---|
| 2026-03-05 09:10:00+08:00 | 4 | 550 | Ws_W2 | 2.192039 | 57.083333 | 550.0 | 549.583333 | 562.72 | 562.916667 | 18310.000000 | 19077.777778 | 763 | -0.116729 | -0.176457 | 0.000000 | 1.030667 | 1.006262 | 767.777778 | True | -25.0 | 11.8 | 767.777778 | 0.0 | 61.089434 | 61.089434 | 1290 | 966 | -0.338857 | 19016.688344 | NaN | NaN | 911.0 | 79.0 |
| 2026-03-05 10:20:00+08:00 | 4 | 620 | Ws_W2 | 2.192039 | 60.000000 | 620.0 | 619.416667 | 632.72 | 632.666667 | 18845.333333 | 19491.600000 | 763 | -0.357054 | -1.968253 | -0.357270 | 1.021200 | 0.847007 | 646.266667 | True | -35.0 | -3.2 | 723.324000 | 77.1 | 396.520349 | 473.620349 | 2100 | 1 | -1.777195 | 19095.079651 | NaN | NaN | 912.0 | 662.0 |
| 2026-03-05 12:00:00+08:00 | 4 | 720 | Ws_W2 | 2.192039 | 57.270000 | 720.0 | 719.416667 | 732.73 | 732.666667 | 18731.624242 | 19426.800000 | 764 | -0.333036 | -1.932593 | 0.000000 | 1.031181 | 0.909916 | 695.175758 | True | -35.0 | -3.8 | 724.272000 | 29.1 | 372.973854 | 402.073854 | 1830 | 1 | -1.969493 | 19053.826146 | NaN | NaN | 910.0 | 575.0 |
| 2026-03-05 13:10:00+08:00 | 4 | 790 | Ws_W2 | 2.192039 | 60.000000 | 790.0 | 789.500000 | 802.70 | 802.666667 | 18790.000000 | 19433.527778 | 762 | -0.448190 | -2.069503 | -0.315425 | 1.017000 | 0.844525 | 643.527778 | True | -30.0 | -2.0 | 722.376000 | 78.8 | 399.250703 | 478.050703 | 2060 | 2 | -1.747507 | 19034.277075 | NaN | NaN | 903.0 | 667.0 |