VI and VO Daily Summary
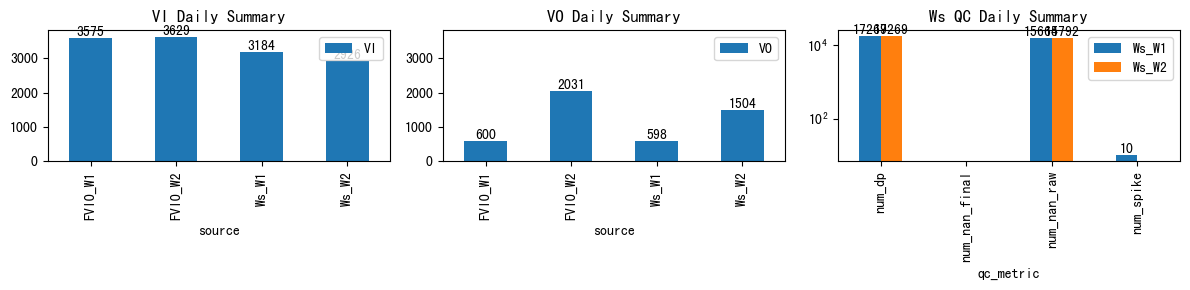
| ws_name | num_dp | num_nan_raw | num_nan_final | num_spike | cum_step_adj |
|---|---|---|---|---|---|
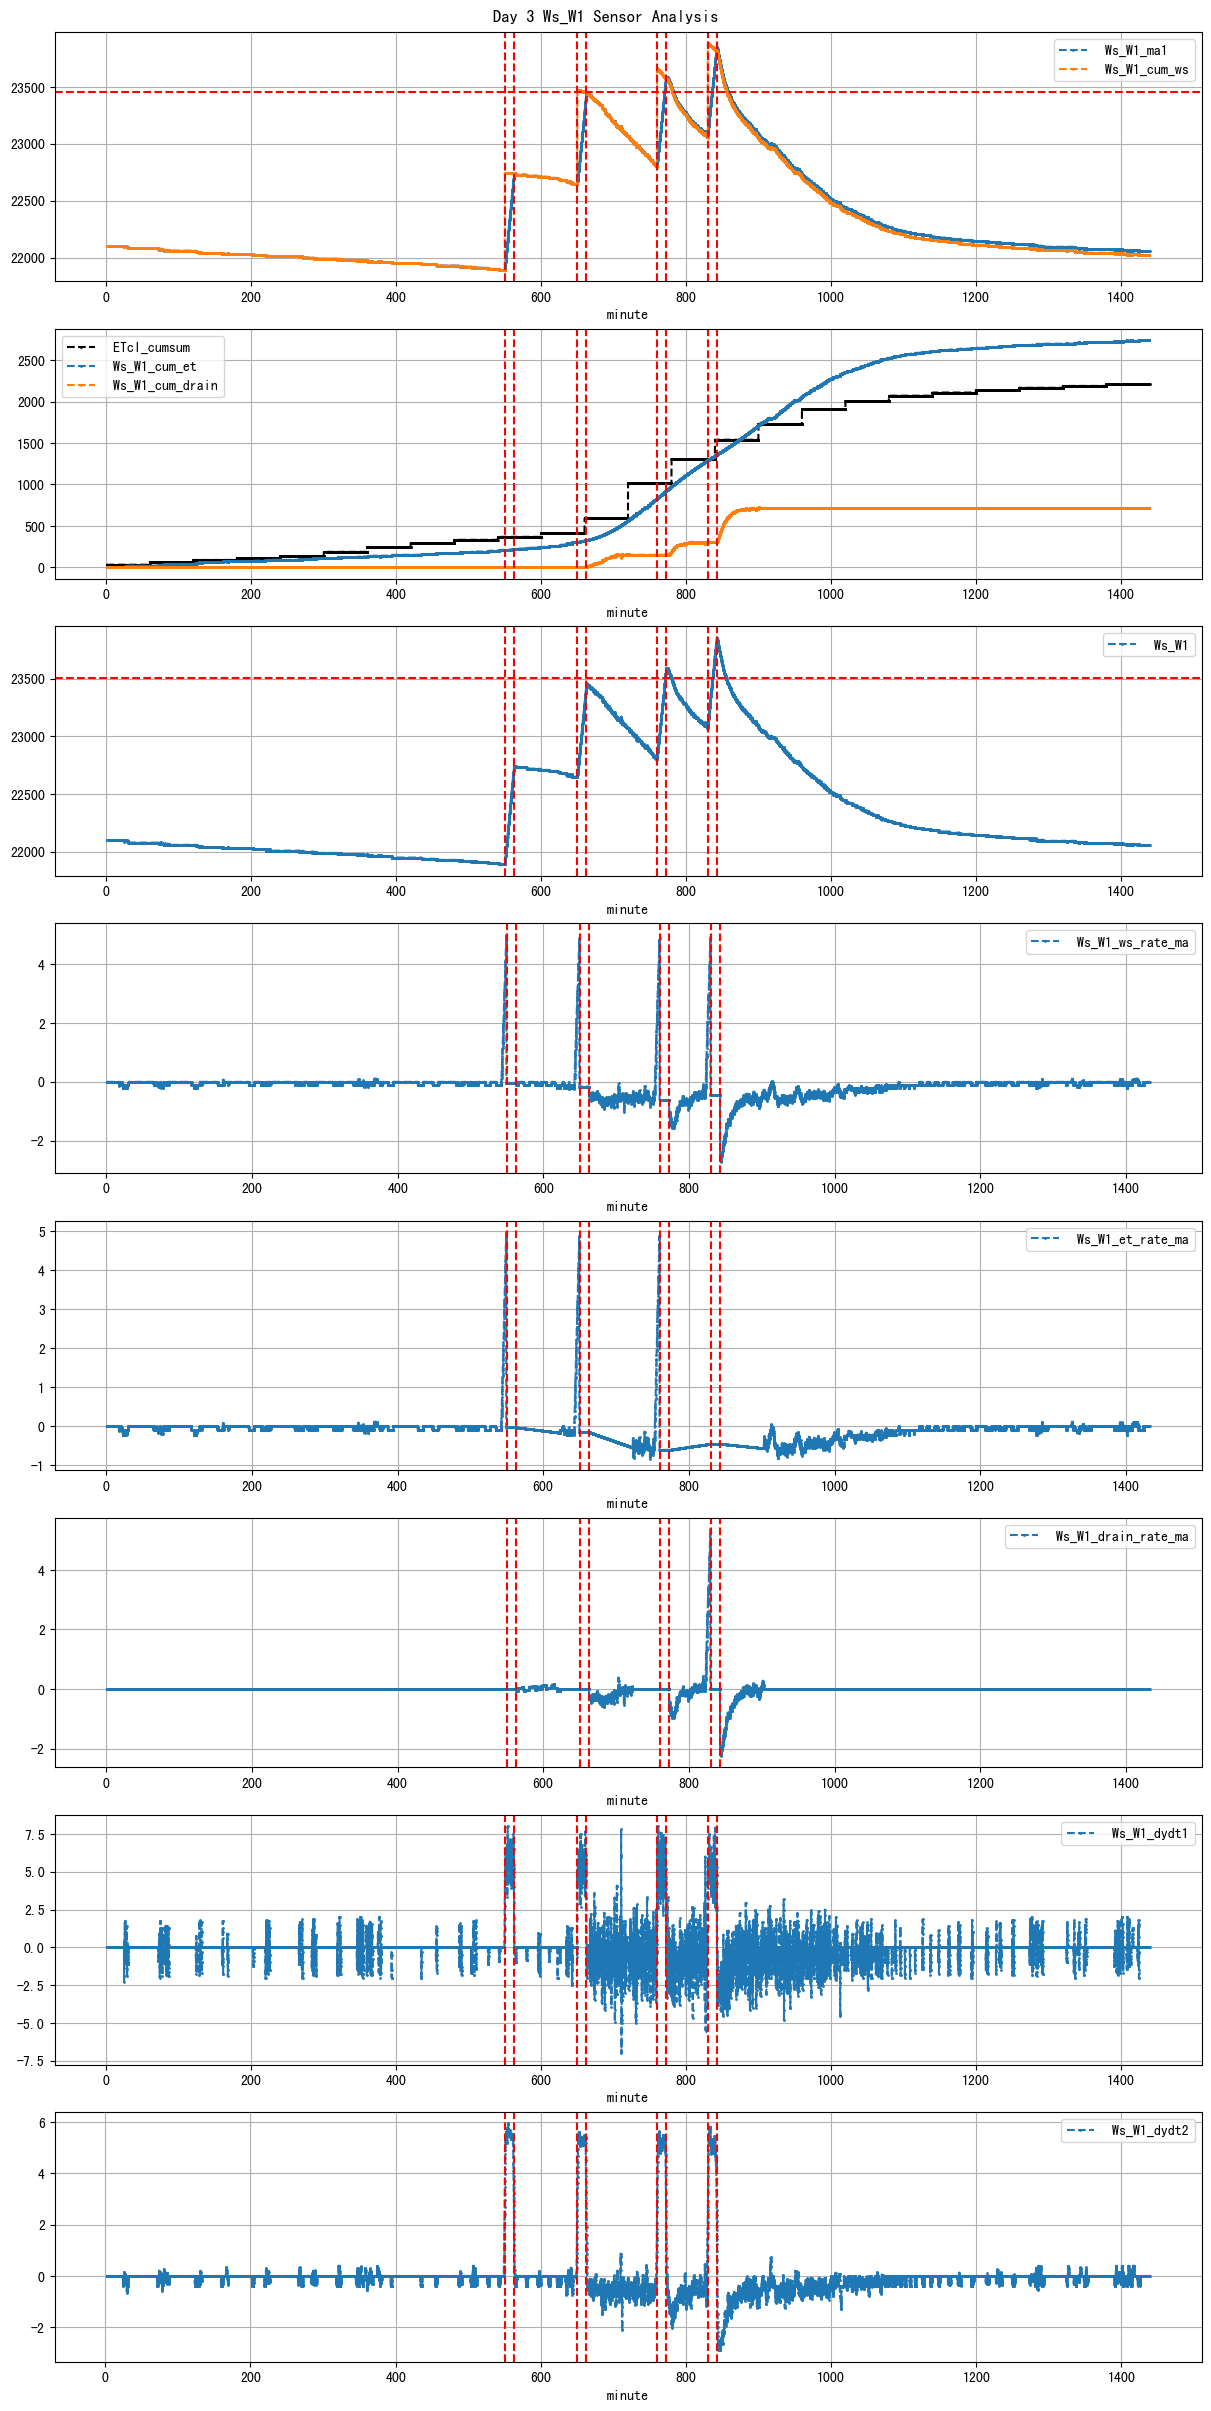
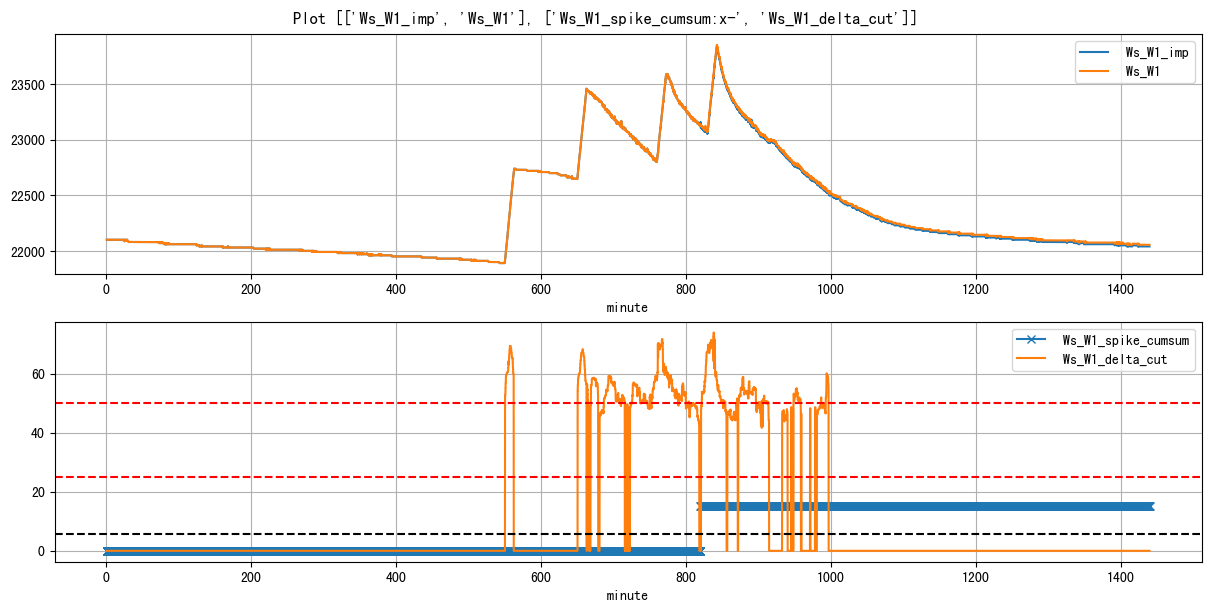
| Ws_W1 | 17,269 | 15,664 | 0 | 10 | 15.00 |
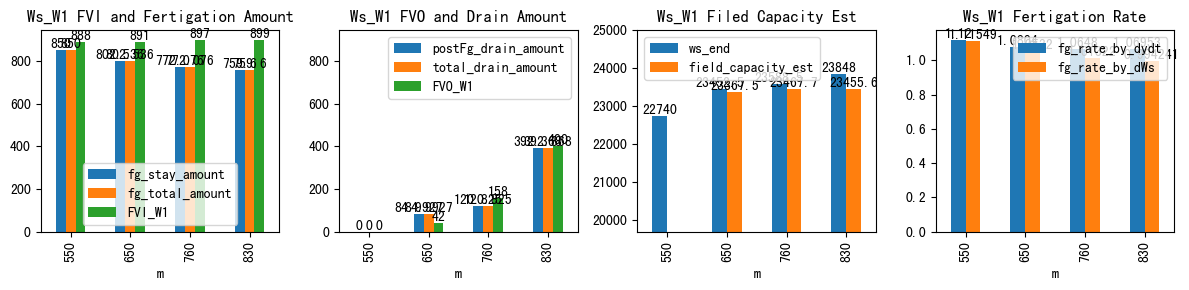
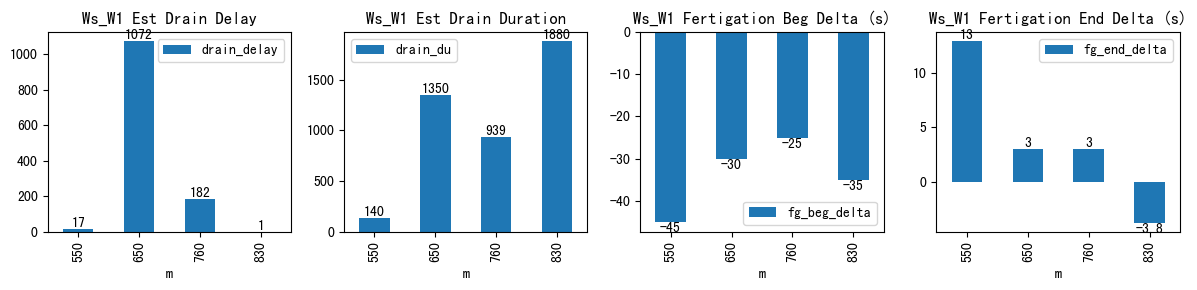
| ds | d | m | ws_name | prominence_cut | max_drain_du | fg_beg | fg_beg_est | fg_end | fg_end_est | ws_beg | ws_end | duc | pre_fg_et | post_fg_ws | post_drn_et | fg_rate_by_dydt | fg_rate_by_dWs | fg_stay_amount | enough_data | fg_beg_delta | fg_end_delta | fg_total_amount | fg_drain_amount | postFg_drain_amount | total_drain_amount | drain_du | drain_delay | drain_rate | field_capacity_est | FVI_W1 | FVO_W1 | FVI_W2 | FVO_W2 |
|---|---|---|---|---|---|---|---|---|---|---|---|---|---|---|---|---|---|---|---|---|---|---|---|---|---|---|---|---|---|---|---|---|---|
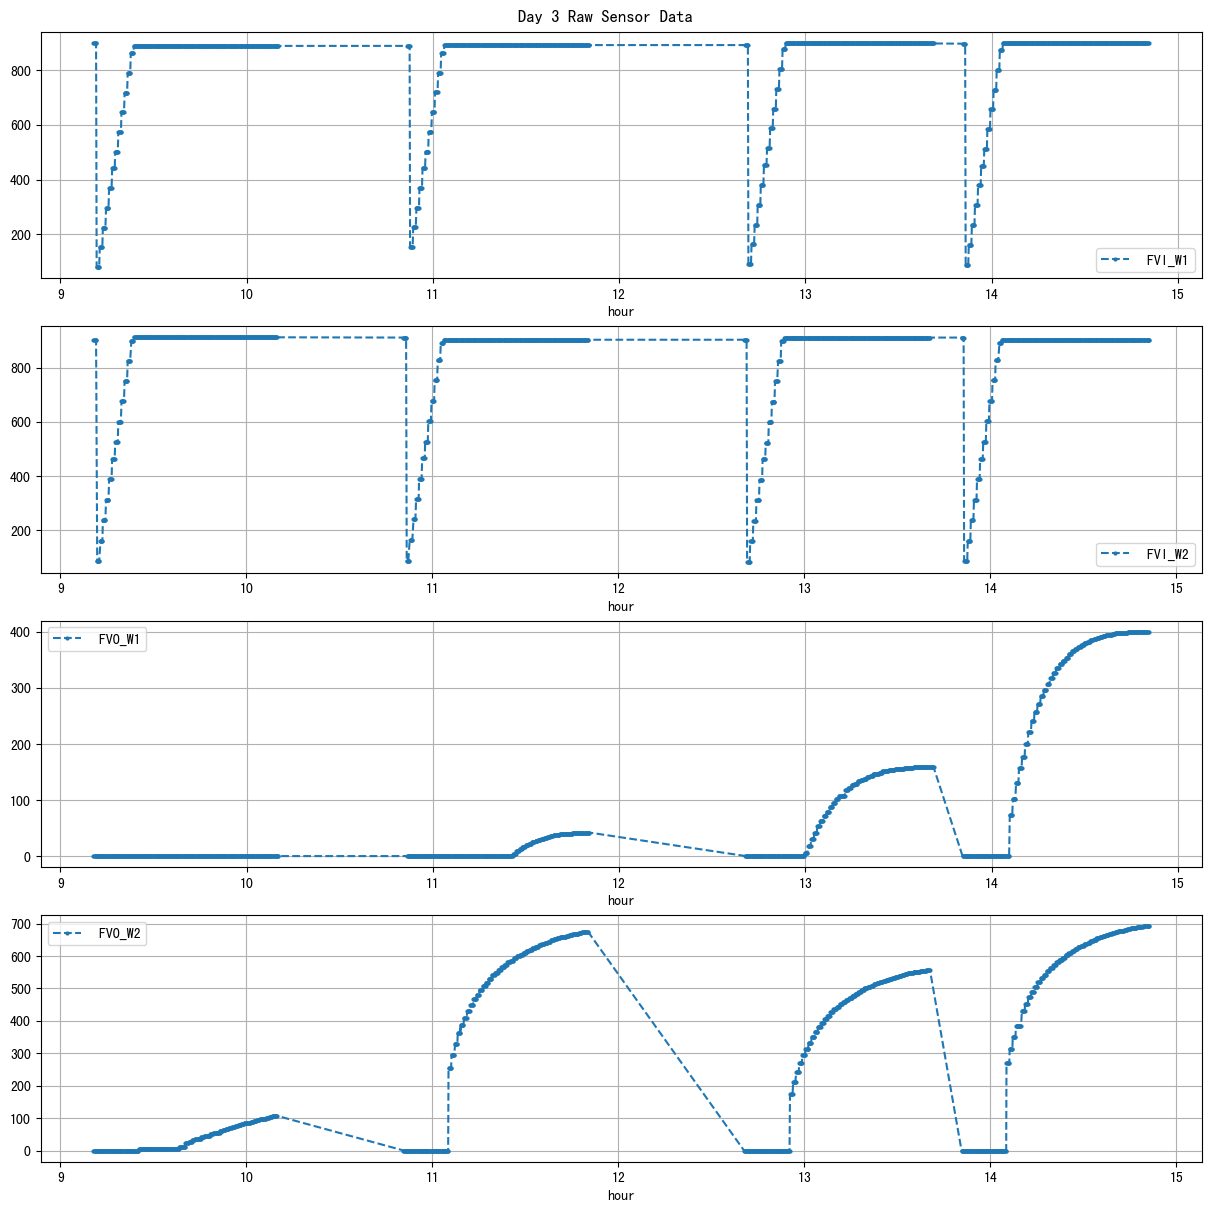
| 2026-03-04 09:10:00+08:00 | 3 | 550 | Ws_W1 | 2.050142 | 60.00 | 550.0 | 549.250000 | 562.70 | 562.916667 | 21890.0 | 22740.000000 | 762 | -0.105436 | -0.034568 | -0.172222 | 1.120000 | 1.115486 | 850.000000 | True | -45.0 | 13.0 | 850.000000 | 0.0 | 0.000000 | 0.000000 | 140 | 17 | -0.074131 | NaN | 888.0 | 0.0 | NaN | NaN |
| 2026-03-04 10:50:00+08:00 | 3 | 650 | Ws_W1 | 2.050142 | 60.00 | 650.0 | 649.500000 | 662.70 | 662.750000 | 22650.0 | 23452.535714 | 762 | -0.158630 | -0.484506 | -0.553131 | 1.080400 | 1.053196 | 802.535714 | True | -30.0 | 3.0 | 802.535714 | 0.0 | 84.992741 | 84.992741 | 1350 | 1072 | -0.503302 | 23367.542974 | 891.0 | 42.0 | NaN | NaN |
| 2026-03-04 12:40:00+08:00 | 3 | 760 | Ws_W1 | 2.050142 | 57.25 | 760.0 | 759.583333 | 772.70 | 772.750000 | 22816.4 | 23588.476190 | 762 | -0.613972 | -1.374074 | 0.000000 | 1.064800 | 1.013223 | 772.076190 | True | -25.0 | 3.0 | 772.076190 | 0.0 | 120.824937 | 120.824937 | 939 | 182 | -0.886806 | 23467.651254 | 897.0 | 158.0 | NaN | NaN |
| 2026-03-04 13:50:00+08:00 | 3 | 830 | Ws_W1 | 2.050142 | 60.00 | 830.0 | 829.416667 | 842.73 | 842.666667 | 23088.4 | 23848.000000 | 764 | -0.456483 | -2.238117 | -0.569706 | 1.069533 | 0.994241 | 759.600000 | True | -35.0 | -3.8 | 759.600000 | 0.0 | 392.367793 | 392.367793 | 1880 | 1 | -1.967372 | 23455.632207 | 899.0 | 400.0 | NaN | NaN |
| ws_name | num_dp | num_nan_raw | num_nan_final | num_spike | cum_step_adj |
|---|---|---|---|---|---|
| Ws_W2 | 17,269 | 15,792 | 0 | 0 | 0.00 |
| ds | d | m | ws_name | prominence_cut | max_drain_du | fg_beg | fg_beg_est | fg_end | fg_end_est | ws_beg | ws_end | duc | pre_fg_et | post_fg_ws | post_drn_et | fg_rate_by_dydt | fg_rate_by_dWs | fg_stay_amount | enough_data | fg_beg_delta | fg_end_delta | fg_total_amount | fg_drain_amount | postFg_drain_amount | total_drain_amount | drain_du | drain_delay | drain_rate | field_capacity_est | FVI_W1 | FVO_W1 | FVI_W2 | FVO_W2 |
|---|---|---|---|---|---|---|---|---|---|---|---|---|---|---|---|---|---|---|---|---|---|---|---|---|---|---|---|---|---|---|---|---|---|
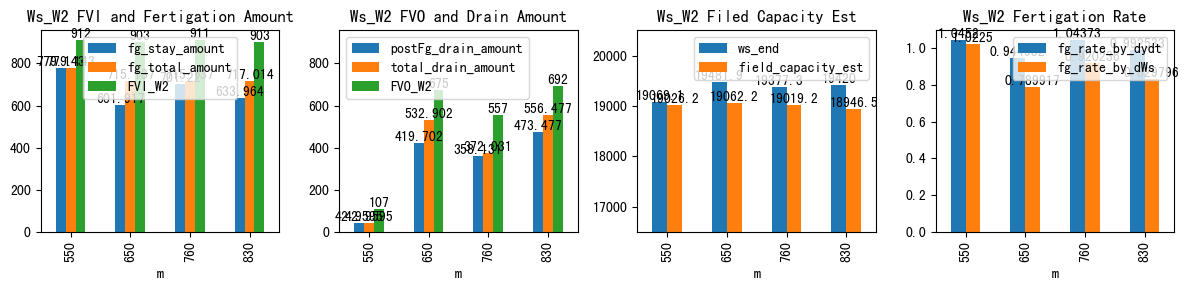
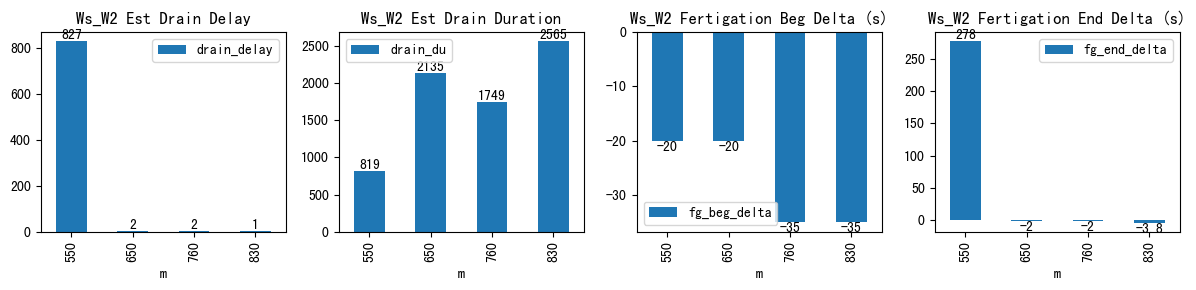
| 2026-03-04 09:10:00+08:00 | 3 | 550 | Ws_W2 | 2.177198 | 60.0 | 550.0 | 549.666667 | 562.70 | 567.333333 | 18290.000000 | 19069.142857 | 762 | -0.063046 | -0.139418 | -0.208025 | 1.045200 | 1.022497 | 779.142857 | True | -20.0 | 278.0 | 779.142857 | 0.0 | 42.959452 | 42.959452 | 819 | 827 | -0.272239 | 19026.183405 | NaN | NaN | 912.0 | 107.0 |
| 2026-03-04 10:50:00+08:00 | 3 | 650 | Ws_W2 | 2.177198 | 60.0 | 650.0 | 649.666667 | 662.70 | 662.666667 | 18880.000000 | 19481.916667 | 762 | -0.199126 | -1.934369 | -0.454784 | 0.944952 | 0.789917 | 601.916667 | True | -20.0 | -2.0 | 715.137000 | 113.2 | 419.702040 | 532.902040 | 2135 | 2 | -1.862166 | 19062.214626 | NaN | NaN | 903.0 | 675.0 |
| 2026-03-04 12:40:00+08:00 | 3 | 760 | Ws_W2 | 2.177198 | 57.3 | 760.0 | 759.416667 | 772.70 | 772.666667 | 18676.113636 | 19377.333333 | 762 | -0.363452 | -1.886991 | 0.000000 | 1.043733 | 0.920236 | 701.219697 | True | -35.0 | -2.0 | 715.137000 | 13.9 | 358.131306 | 372.031306 | 1749 | 2 | -1.802585 | 19019.202027 | NaN | NaN | 911.0 | 557.0 |
| 2026-03-04 13:50:00+08:00 | 3 | 830 | Ws_W2 | 2.177198 | 60.0 | 830.0 | 829.416667 | 842.73 | 842.666667 | 18786.035714 | 19420.000000 | 764 | -0.291857 | -2.089935 | -0.210847 | 0.992533 | 0.829796 | 633.964286 | True | -35.0 | -3.8 | 717.014000 | 83.0 | 473.477079 | 556.477079 | 2565 | 1 | -1.959748 | 18946.522921 | NaN | NaN | 903.0 | 692.0 |