| 2026-01-13 09:50:00+08:00 |
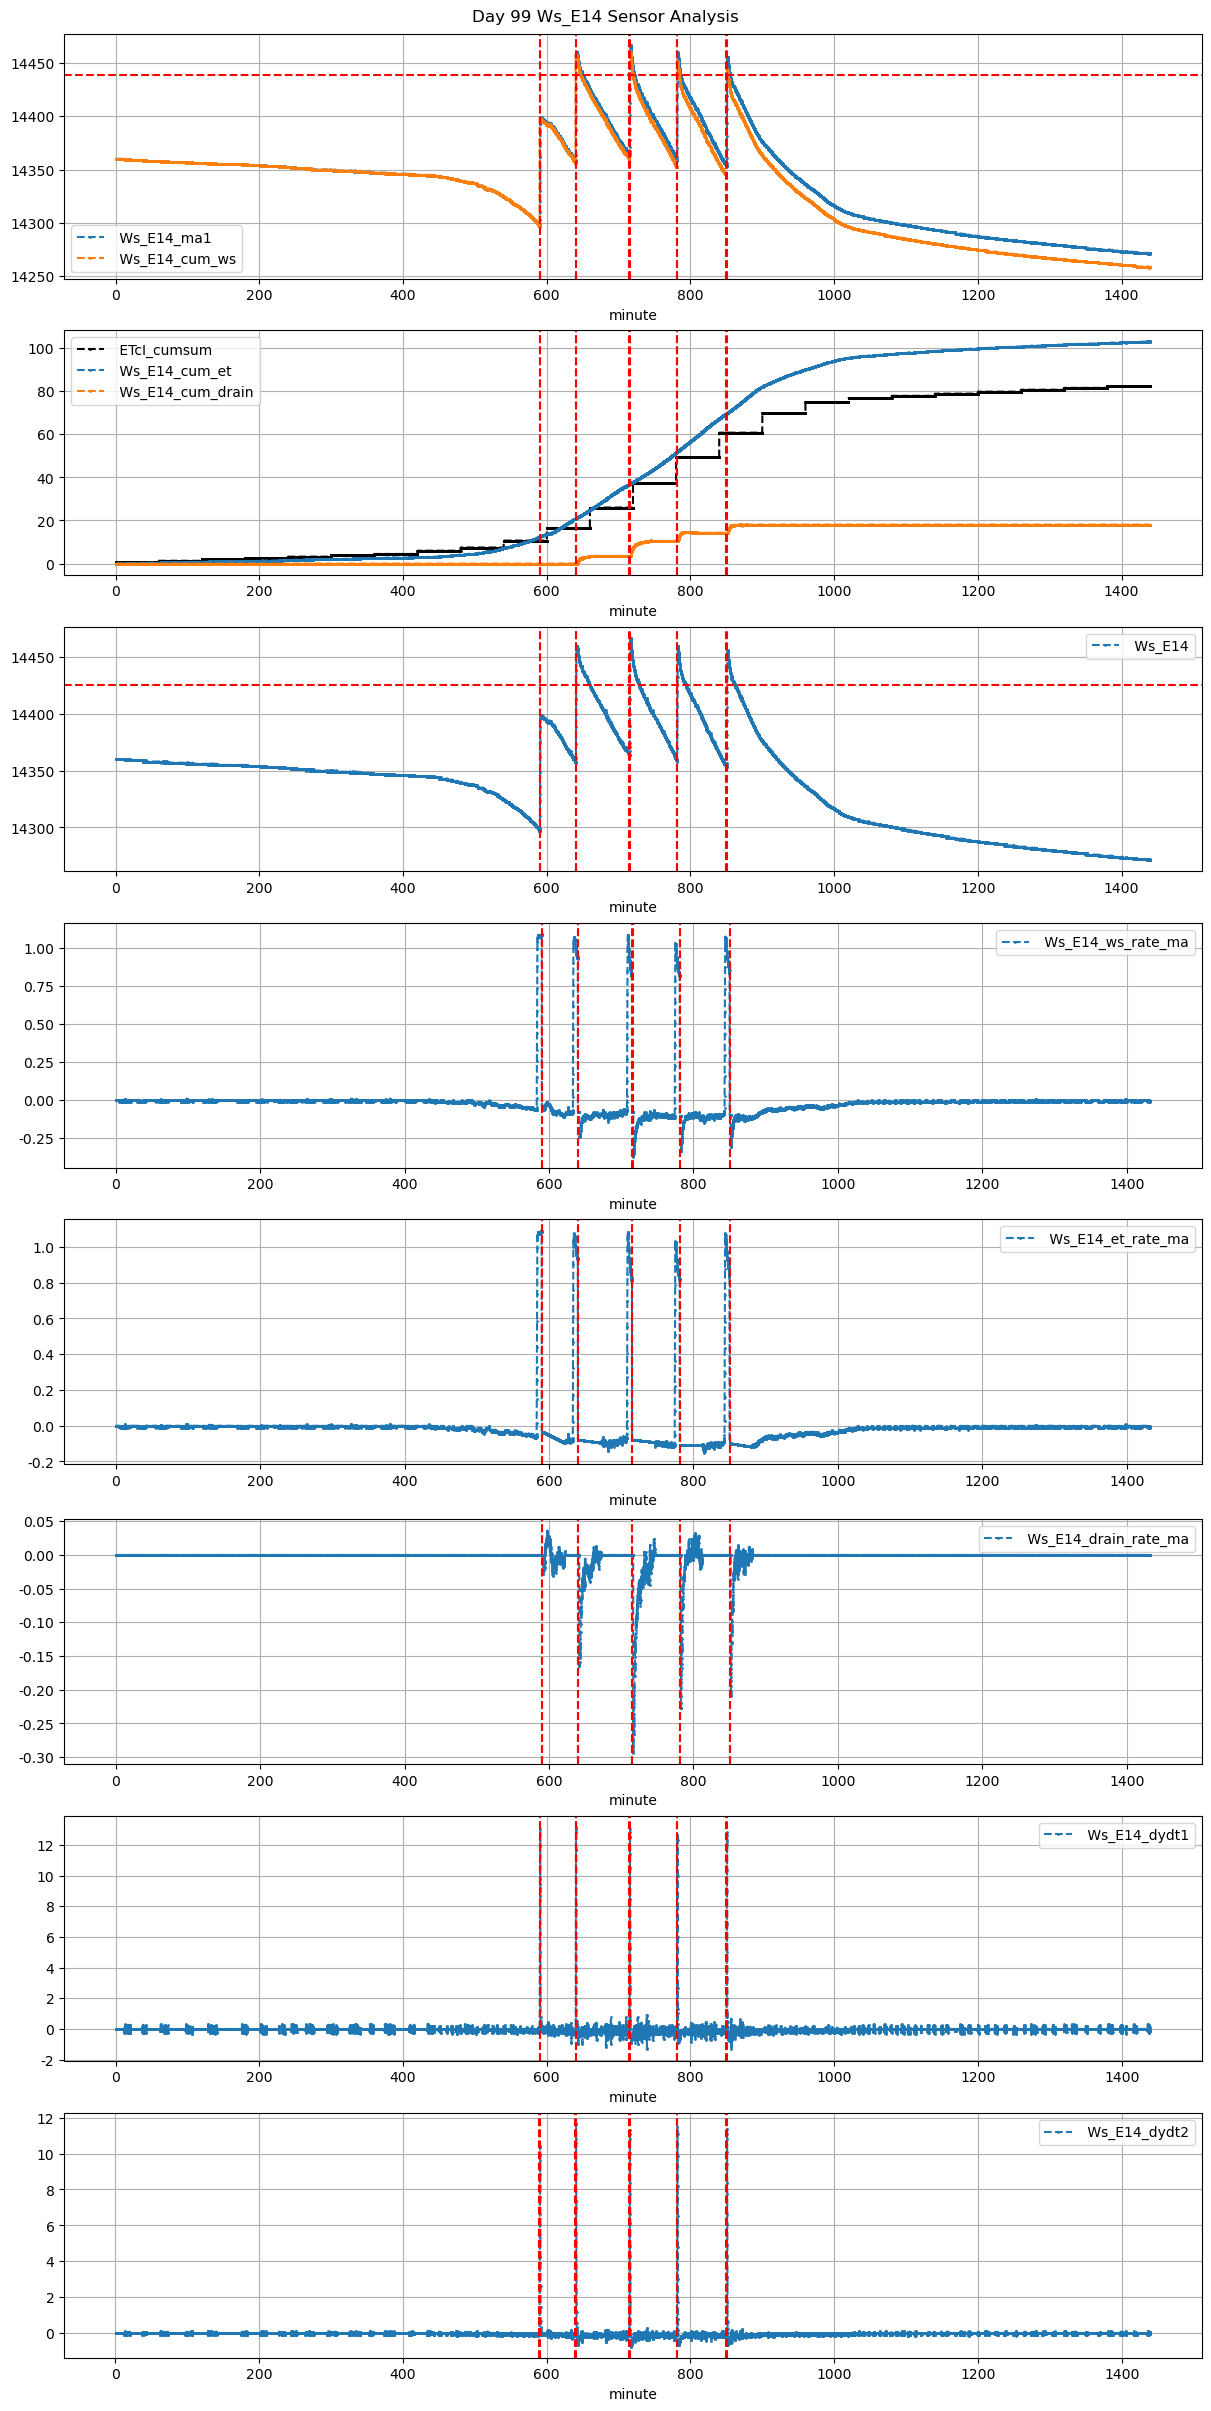
99 |
590 |
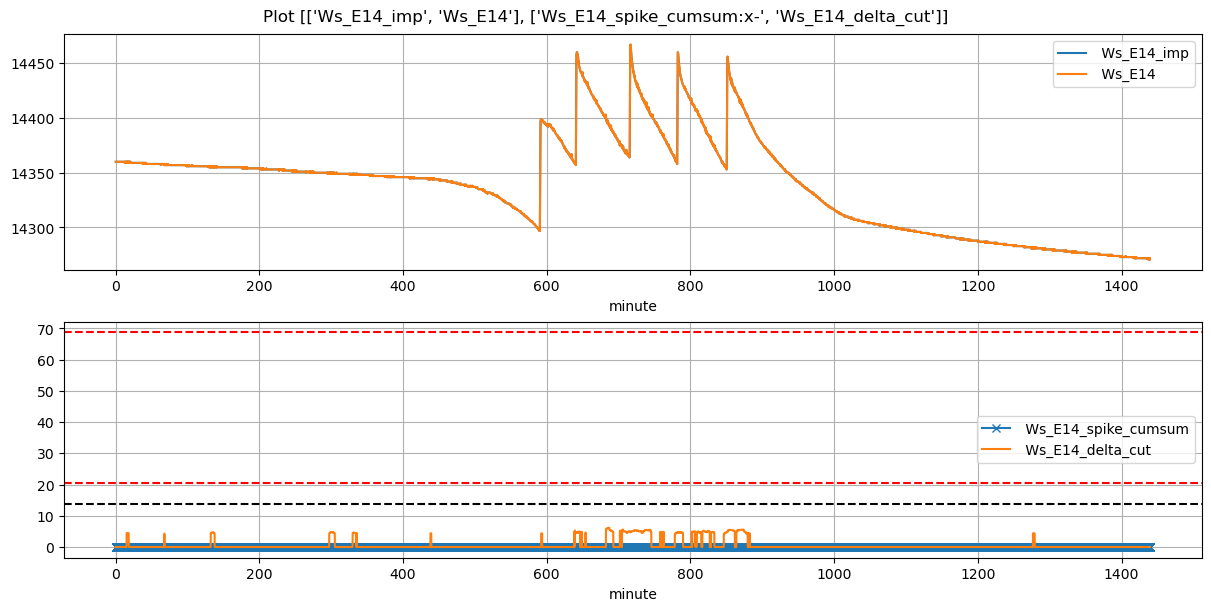
Ws_E14 |
0.377985 |
30 |
590.00 |
590.333333 |
590.60 |
591.833333 |
14298.000000 |
14399.0 |
36 |
-0.063559 |
-0.052513 |
-0.101270 |
0.366286 |
0.561111 |
20.200000 |
True |
20.0 |
74.0 |
20.718 |
0.0 |
0.000000 |
0.000000 |
30 |
638 |
-0.250415 |
NaN |
NaN |
NaN |
| 2026-01-13 10:40:00+08:00 |
99 |
640 |
Ws_E14 |
0.377985 |
30 |
640.00 |
640.416667 |
640.60 |
641.833333 |
14359.000000 |
14460.0 |
36 |
-0.086458 |
-0.195937 |
-0.095139 |
0.400714 |
0.561111 |
20.200000 |
True |
25.0 |
74.0 |
20.718 |
0.0 |
0.000000 |
0.000000 |
30 |
173 |
-0.519330 |
NaN |
NaN |
NaN |
| 2026-01-13 11:55:00+08:00 |
99 |
715 |
Ws_E14 |
0.377985 |
30 |
715.00 |
715.333333 |
715.60 |
716.583333 |
14365.000000 |
14467.0 |
36 |
-0.064124 |
-0.294236 |
-0.083739 |
0.402143 |
0.566667 |
20.400000 |
True |
20.0 |
59.0 |
20.718 |
0.3 |
7.902532 |
8.202532 |
234 |
83 |
-0.685116 |
14427.487341 |
NaN |
NaN |
| 2026-01-13 13:01:01+08:00 |
99 |
781 |
Ws_E14 |
0.377985 |
30 |
781.02 |
781.500000 |
781.62 |
782.416667 |
14360.000000 |
14460.0 |
36 |
-0.107083 |
-0.257546 |
-0.111829 |
0.431143 |
0.555556 |
20.000000 |
True |
28.8 |
47.8 |
20.718 |
0.0 |
3.705113 |
3.705113 |
130 |
77 |
-0.505438 |
NaN |
NaN |
NaN |
| 2026-01-13 14:10:00+08:00 |
99 |
850 |
Ws_E14 |
0.377985 |
30 |
850.00 |
850.416667 |
850.60 |
851.583333 |
14355.216667 |
14456.0 |
36 |
-0.089018 |
-0.229375 |
-0.117982 |
0.408571 |
0.559907 |
20.156667 |
True |
25.0 |
59.0 |
20.718 |
0.0 |
4.124453 |
4.124453 |
210 |
104 |
-0.572001 |
NaN |
NaN |
NaN |