| 2026-01-14 08:35:00+08:00 |
100 |
515 |
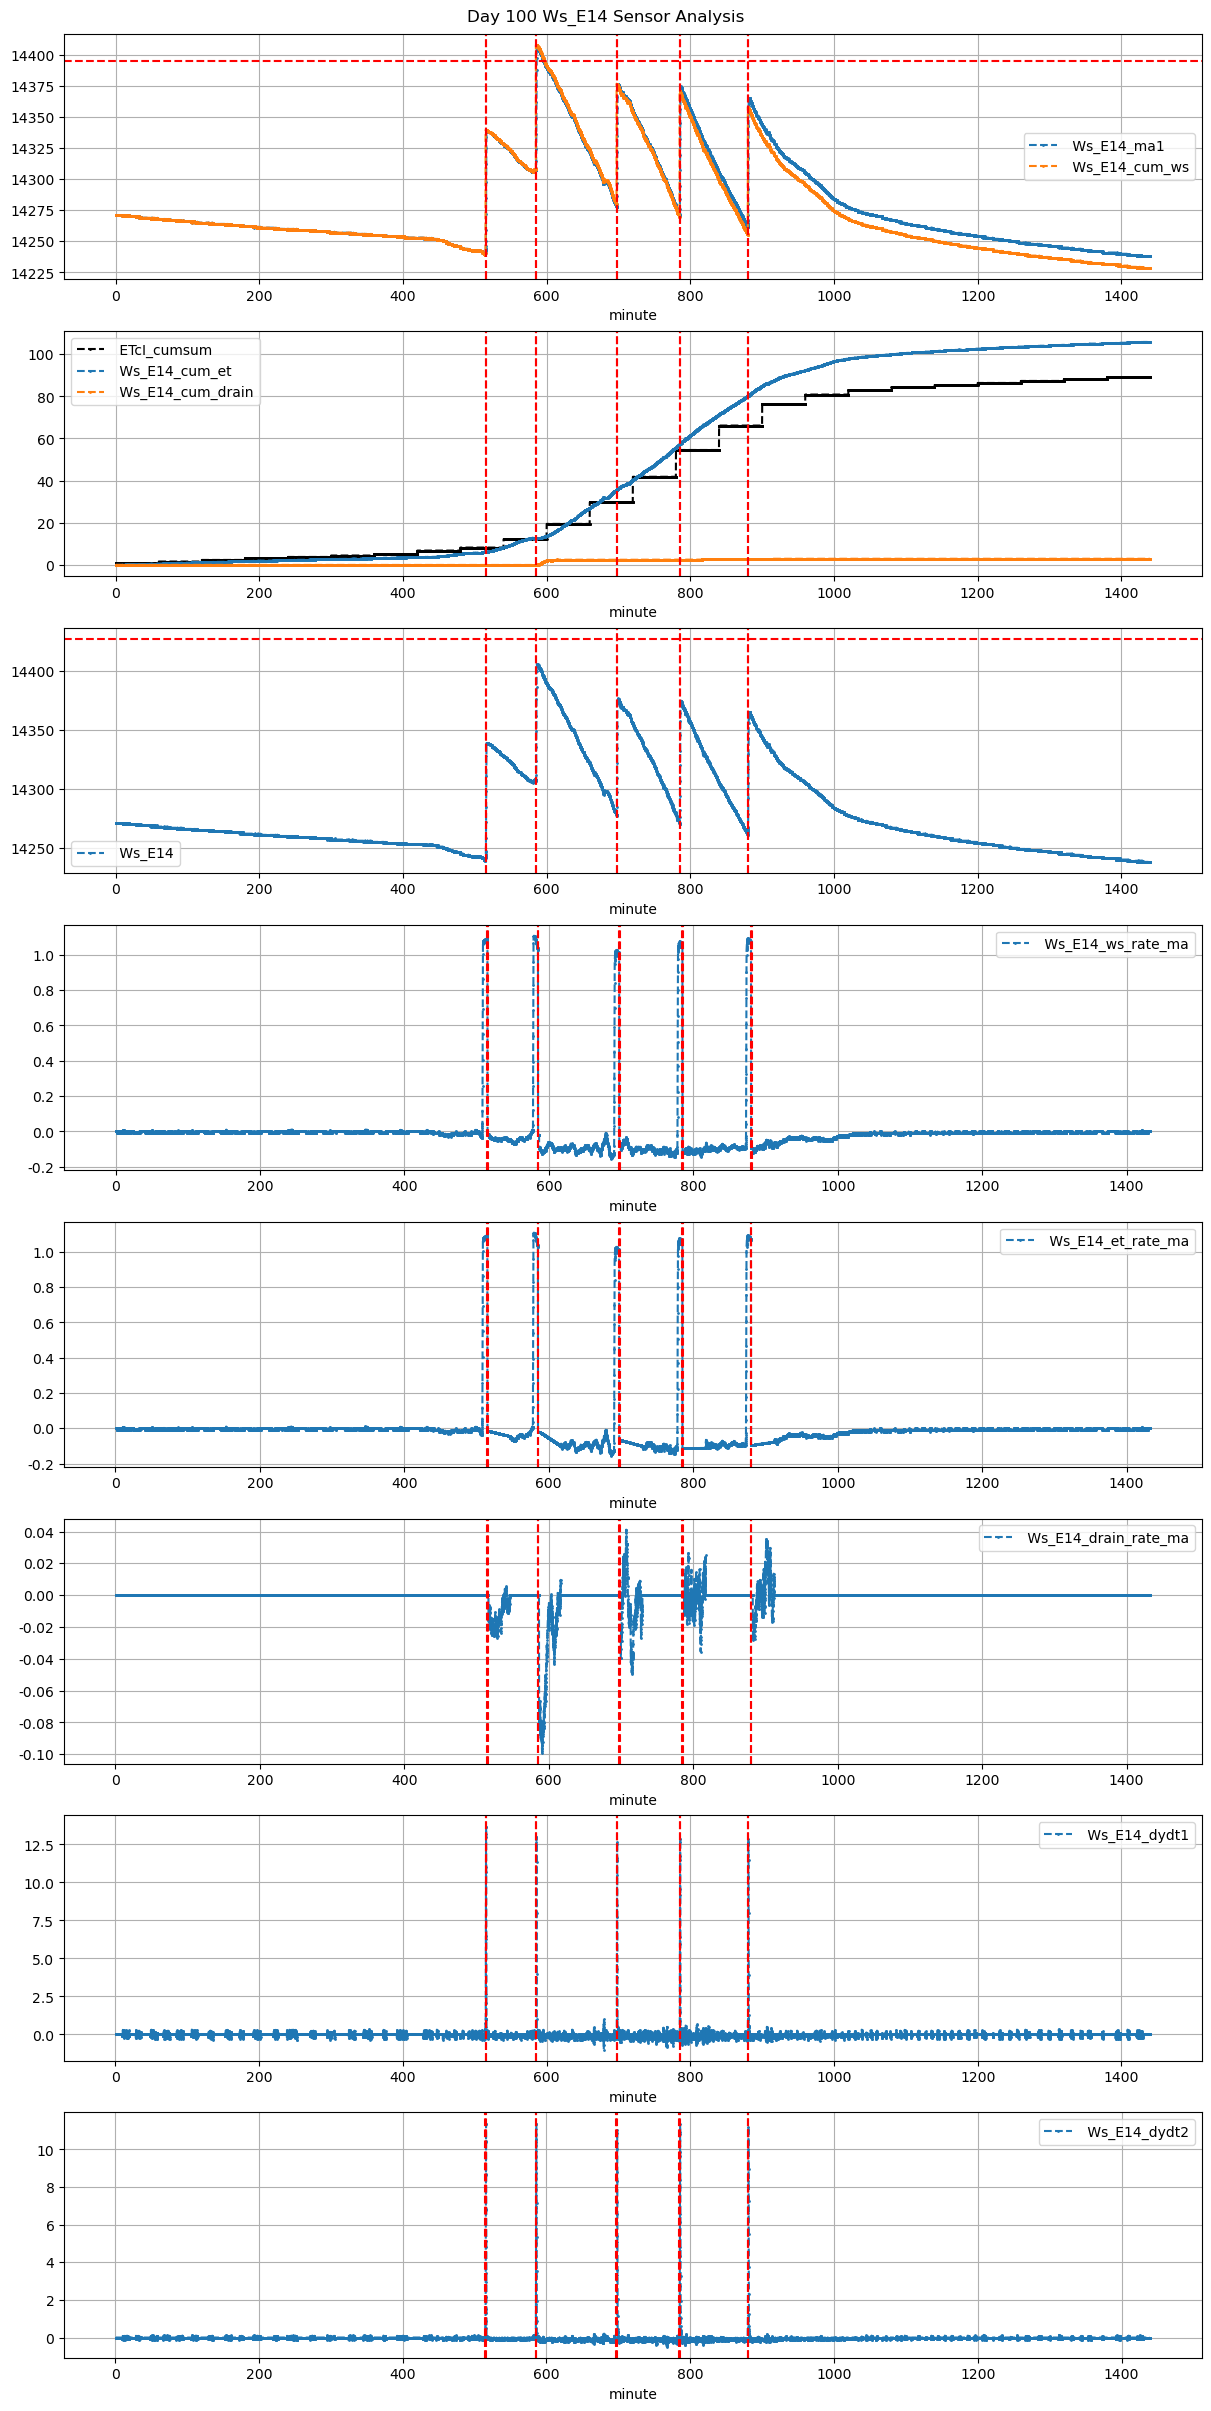
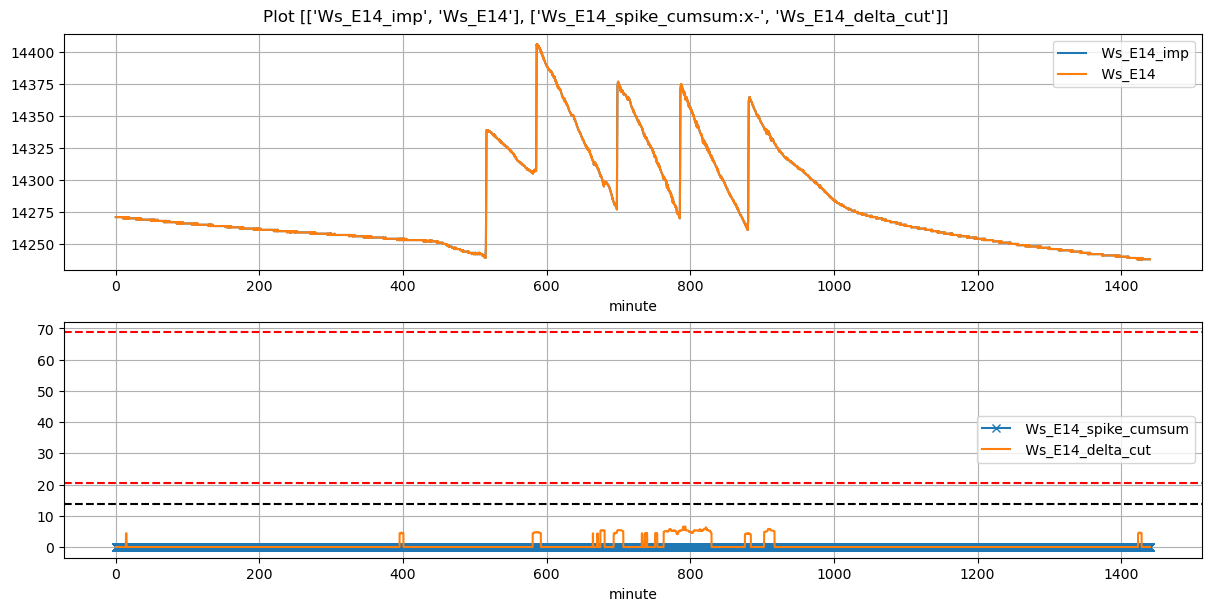
Ws_E14 |
0.283309 |
30 |
515.0 |
515.416667 |
515.6 |
516.333333 |
14239.844444 |
14339.0 |
36 |
-0.029270 |
-0.028542 |
-0.044861 |
0.416714 |
0.550864 |
19.831111 |
True |
25.0 |
44.0 |
20.664 |
0.0 |
0 |
0.0 |
9 |
203 |
-0.227345 |
NaN |
NaN |
NaN |
| 2026-01-14 09:45:00+08:00 |
100 |
585 |
Ws_E14 |
0.283309 |
30 |
585.0 |
585.416667 |
585.6 |
586.166667 |
14306.000000 |
14406.0 |
36 |
-0.004802 |
-0.097726 |
-0.092937 |
0.429000 |
0.555556 |
20.000000 |
True |
25.0 |
34.0 |
20.664 |
0.0 |
0 |
0.0 |
35 |
203 |
-0.268802 |
NaN |
NaN |
NaN |
| 2026-01-14 11:37:24+08:00 |
100 |
697 |
Ws_E14 |
0.283309 |
30 |
697.4 |
697.833333 |
698.0 |
699.583333 |
14279.533333 |
14377.0 |
36 |
-0.136632 |
-0.078773 |
-0.094000 |
0.348143 |
0.541481 |
19.493333 |
True |
26.0 |
95.0 |
20.664 |
0.0 |
0 |
0.0 |
10 |
249 |
-0.277120 |
NaN |
NaN |
NaN |
| 2026-01-14 13:05:00+08:00 |
100 |
785 |
Ws_E14 |
0.283309 |
30 |
785.0 |
785.416667 |
785.6 |
787.166667 |
14272.300000 |
14375.0 |
36 |
-0.117644 |
-0.113826 |
-0.115015 |
0.374810 |
0.570556 |
20.540000 |
True |
25.0 |
94.0 |
20.664 |
0.0 |
0 |
0.0 |
15 |
173 |
-0.386036 |
NaN |
NaN |
NaN |
| 2026-01-14 14:40:00+08:00 |
100 |
880 |
Ws_E14 |
0.283309 |
30 |
880.0 |
880.416667 |
880.6 |
882.250000 |
14263.000000 |
14365.0 |
36 |
-0.096002 |
-0.115204 |
-0.085093 |
0.348714 |
0.566667 |
20.400000 |
True |
25.0 |
99.0 |
20.664 |
0.0 |
0 |
0.0 |
45 |
138 |
-0.263950 |
NaN |
NaN |
NaN |