| 2026-01-13 09:50:00+08:00 |
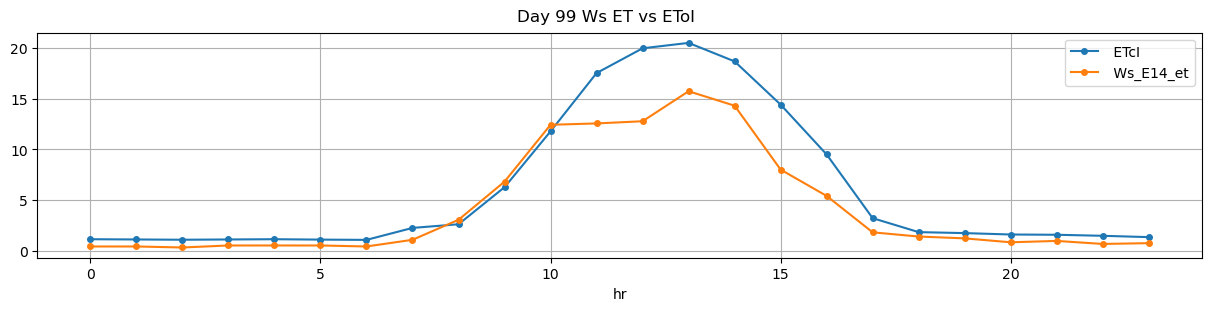
99 |
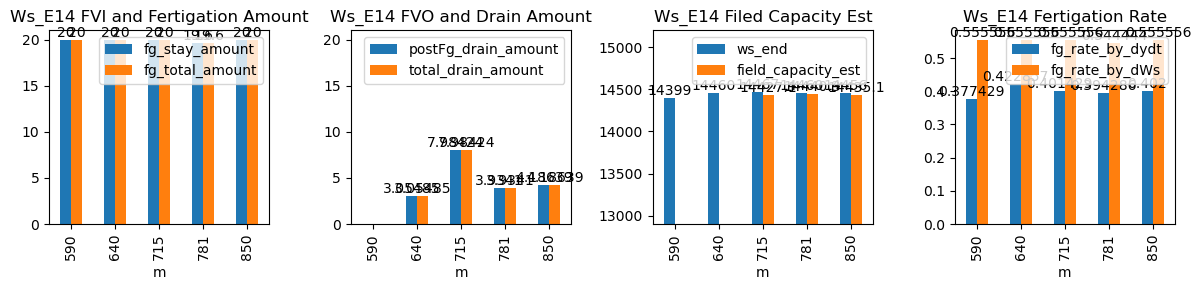
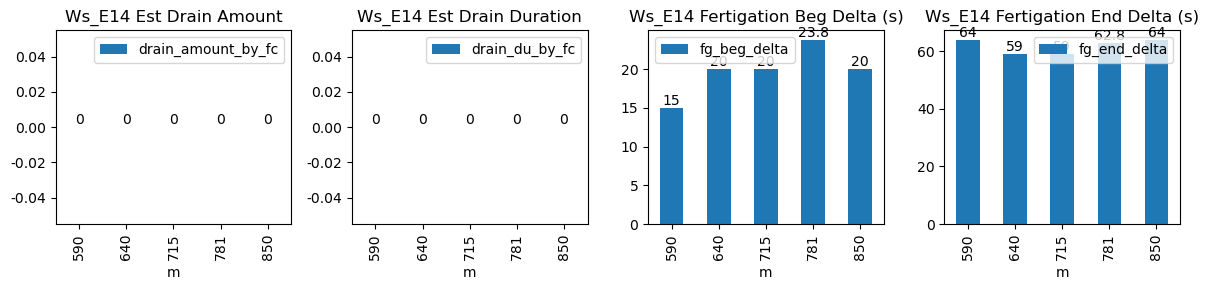
590 |
Ws_E14 |
0.375361 |
30 |
590.00 |
590.250000 |
590.60 |
591.666667 |
NaN |
NaN |
NaN |
14299.0 |
14399.0 |
36 |
-0.061723 |
-0.055694 |
-0.099963 |
0.377429 |
0.555556 |
20.0 |
15.0 |
64.0 |
20.0 |
0.0 |
-1.460352 |
NaN |
-1.460352 |
| 2026-01-13 10:40:00+08:00 |
99 |
640 |
Ws_E14 |
0.375361 |
30 |
640.00 |
640.333333 |
640.60 |
641.583333 |
NaN |
NaN |
NaN |
14360.0 |
14460.0 |
36 |
-0.085046 |
-0.205000 |
-0.094931 |
0.422857 |
0.555556 |
20.0 |
20.0 |
59.0 |
20.0 |
0.0 |
3.054852 |
NaN |
3.054852 |
| 2026-01-13 11:55:00+08:00 |
99 |
715 |
Ws_E14 |
0.375361 |
30 |
715.00 |
715.333333 |
715.60 |
716.583333 |
NaN |
NaN |
NaN |
14367.0 |
14467.0 |
36 |
-0.061394 |
-0.294861 |
-0.083600 |
0.401429 |
0.555556 |
20.0 |
20.0 |
59.0 |
20.0 |
0.0 |
7.984244 |
14427.078780 |
7.984244 |
| 2026-01-13 13:01:01+08:00 |
99 |
781 |
Ws_E14 |
0.375361 |
30 |
781.02 |
781.416667 |
781.62 |
782.666667 |
NaN |
NaN |
NaN |
14362.0 |
14460.0 |
36 |
-0.104583 |
-0.244306 |
-0.112981 |
0.394286 |
0.544444 |
19.6 |
23.8 |
62.8 |
19.6 |
0.0 |
3.934101 |
14440.329497 |
3.934101 |
| 2026-01-13 14:10:00+08:00 |
99 |
850 |
Ws_E14 |
0.375361 |
30 |
850.00 |
850.333333 |
850.60 |
851.666667 |
NaN |
NaN |
NaN |
14356.0 |
14456.0 |
36 |
-0.088277 |
-0.229722 |
-0.117816 |
0.402000 |
0.555556 |
20.0 |
20.0 |
64.0 |
20.0 |
0.0 |
4.186394 |
14435.068029 |
4.186394 |