| 2026-01-14 08:35:00+08:00 |
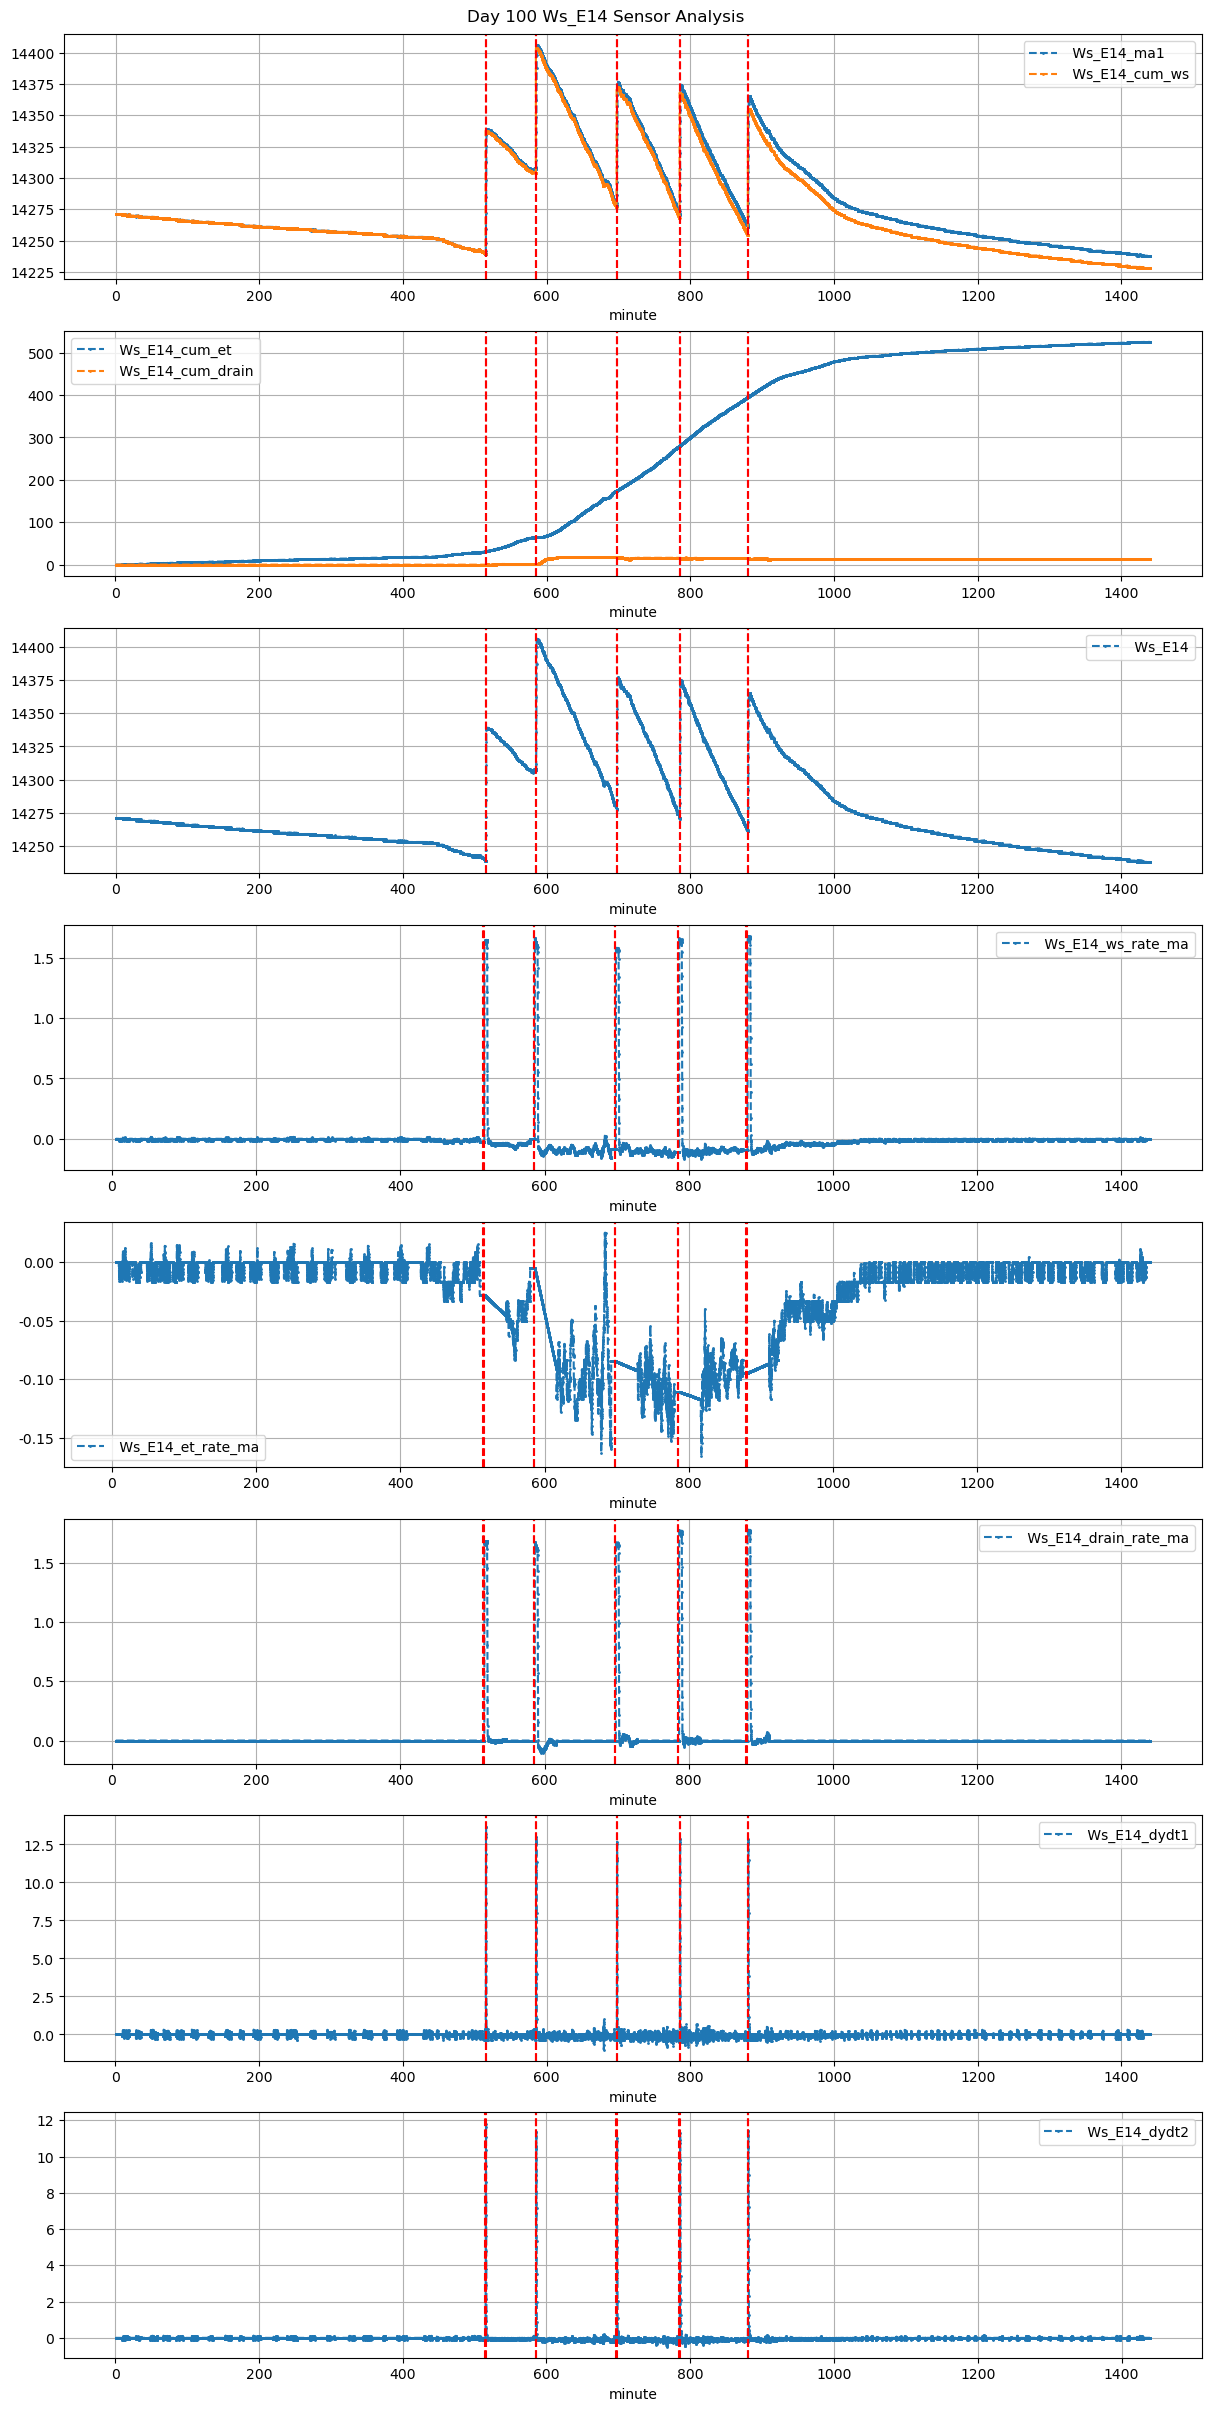
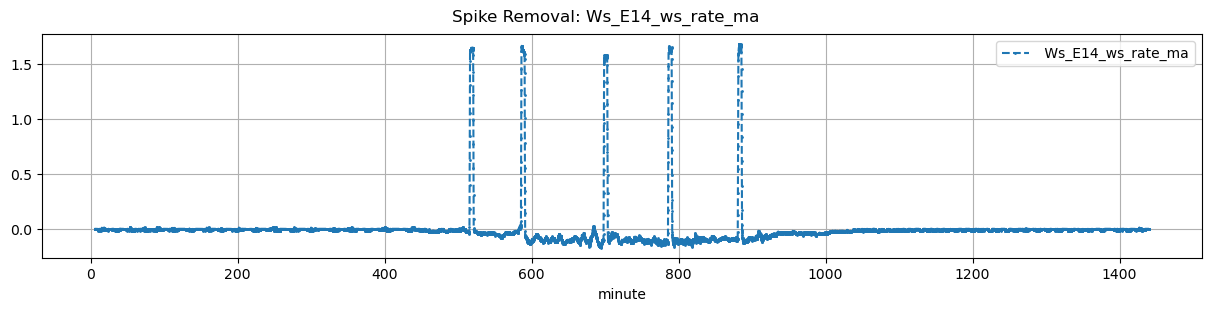
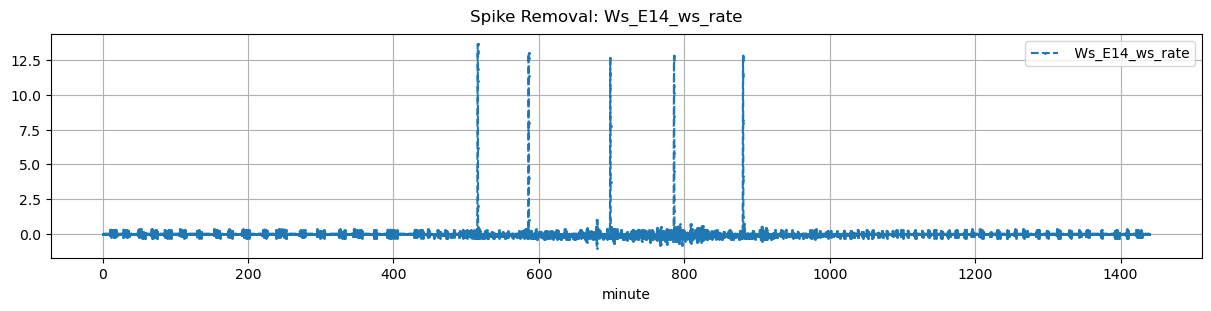
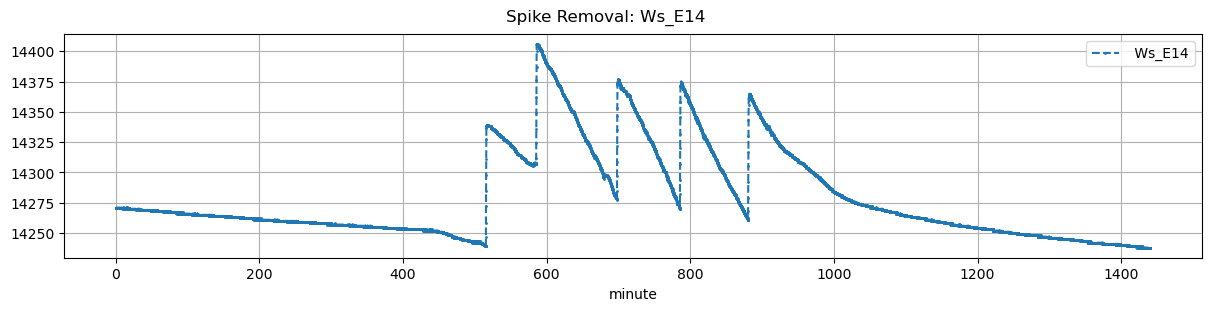
100 |
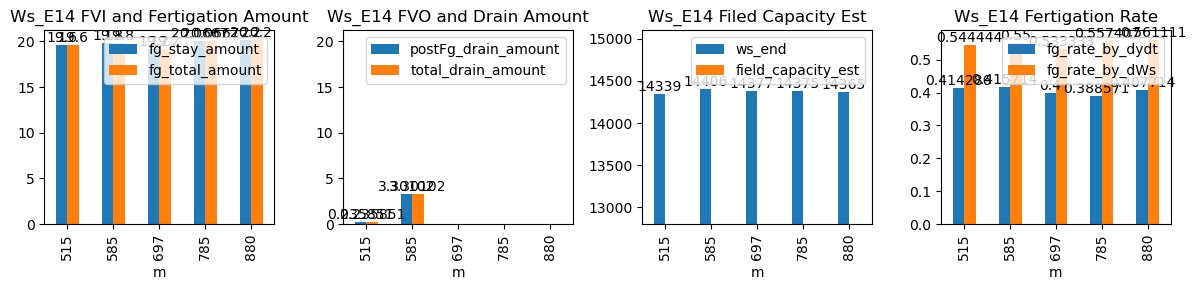
515 |
Ws_E14 |
0.282901 |
30 |
515.0 |
515.333333 |
515.6 |
516.583333 |
NaN |
NaN |
NaN |
14241.000000 |
14339.0 |
36 |
-0.028564 |
-0.028056 |
-0.045694 |
0.414286 |
0.544444 |
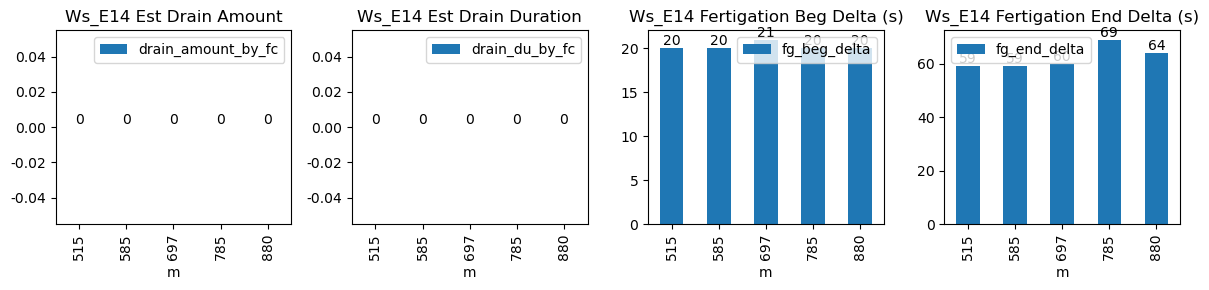
19.600000 |
20.0 |
59.0 |
19.600000 |
0.0 |
0.235851 |
NaN |
0.235851 |
| 2026-01-14 09:45:00+08:00 |
100 |
585 |
Ws_E14 |
0.282901 |
30 |
585.0 |
585.333333 |
585.6 |
586.583333 |
NaN |
NaN |
NaN |
14307.000000 |
14406.0 |
36 |
-0.005367 |
-0.100000 |
-0.091409 |
0.415714 |
0.550000 |
19.800000 |
20.0 |
59.0 |
19.800000 |
0.0 |
3.301023 |
NaN |
3.301023 |
| 2026-01-14 11:37:24+08:00 |
100 |
697 |
Ws_E14 |
0.282901 |
30 |
697.4 |
697.750000 |
698.0 |
699.000000 |
NaN |
NaN |
NaN |
14281.000000 |
14377.0 |
36 |
-0.133715 |
-0.084722 |
-0.092523 |
0.400000 |
0.533333 |
19.200000 |
21.0 |
60.0 |
19.200000 |
0.0 |
-0.237568 |
NaN |
-0.237568 |
| 2026-01-14 13:05:00+08:00 |
100 |
785 |
Ws_E14 |
0.282901 |
30 |
785.0 |
785.333333 |
785.6 |
786.750000 |
NaN |
NaN |
NaN |
14274.666667 |
14375.0 |
36 |
-0.116066 |
-0.110556 |
-0.117222 |
0.388571 |
0.557407 |
20.066667 |
20.0 |
69.0 |
20.066667 |
0.0 |
-0.318955 |
NaN |
-0.318955 |
| 2026-01-14 14:40:00+08:00 |
100 |
880 |
Ws_E14 |
0.282901 |
30 |
880.0 |
880.333333 |
880.6 |
881.666667 |
NaN |
NaN |
NaN |
14264.000000 |
14365.0 |
36 |
-0.094448 |
-0.111667 |
-0.086329 |
0.407714 |
0.561111 |
20.200000 |
20.0 |
64.0 |
20.200000 |
0.0 |
-0.651110 |
NaN |
-0.651110 |