VI and VO Daily Summary
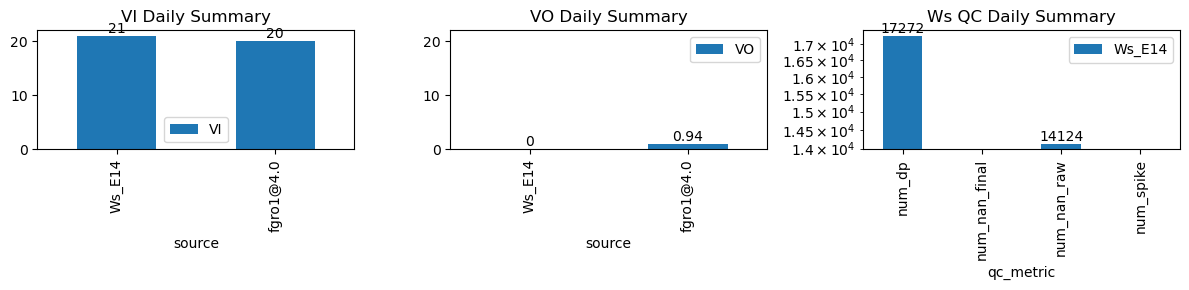
| ws_name | num_dp | num_nan_raw | num_nan_final | num_spike | cum_step_adj |
|---|---|---|---|---|---|
| Ws_E14 | 17,272 | 14,124 | 0 | 0 | 0.00 |
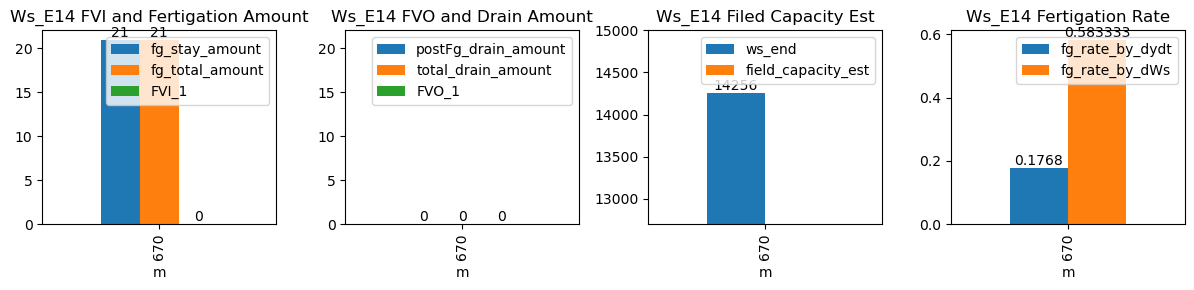
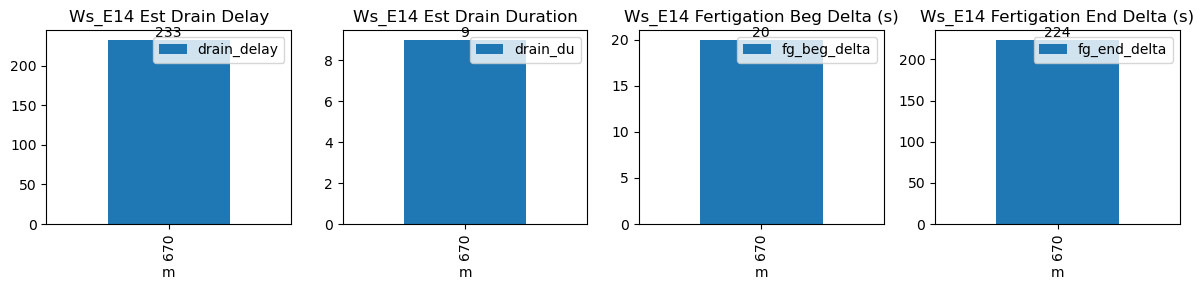
| ds | d | m | ws_name | prominence_cut | max_drain_du | fg_beg | fg_beg_est | fg_end | fg_end_est | ws_beg | ws_end | duc | pre_fg_et | post_fg_ws | post_drn_et | fg_rate_by_dydt | fg_rate_by_dWs | fg_stay_amount | enough_data | fg_beg_delta | fg_end_delta | fg_total_amount | fg_drain_amount | postFg_drain_amount | total_drain_amount | drain_du | drain_delay | drain_rate | field_capacity_est | FVI_1 | FVO_1 |
|---|---|---|---|---|---|---|---|---|---|---|---|---|---|---|---|---|---|---|---|---|---|---|---|---|---|---|---|---|---|---|---|
| 2026-01-31 11:10:00+08:00 | 117 | 670 | Ws_E14 | 0.175354 | 30 | 670.0 | 670.333333 | 670.6 | 674.333333 | 14151.0 | 14256.0 | 36 | 0.0 | -0.023854 | -0.018472 | 0.1768 | 0.583333 | 21.0 | True | 20.0 | 224.0 | 21.0 | 0.0 | 0 | 0.0 | 9 | 233 | -0.243337 | NaN | NaN | NaN |