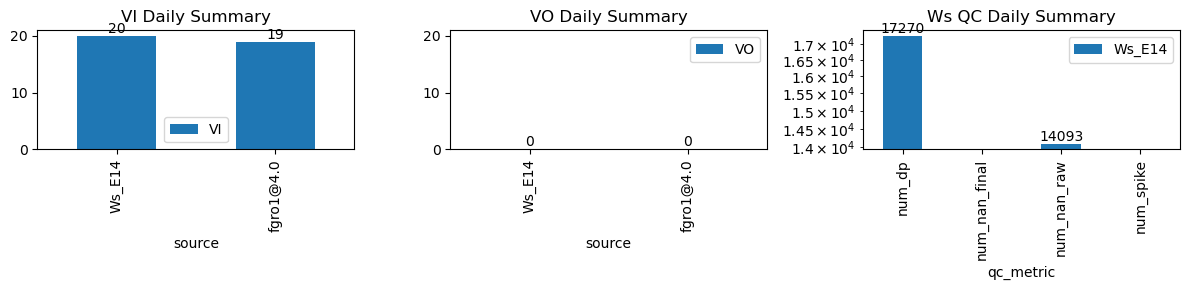
VI and VO Daily Summary
| ws_name | num_dp | num_nan_raw | num_nan_final | num_spike | cum_step_adj |
|---|---|---|---|---|---|
| Ws_E14 | 17,270 | 14,093 | 0 | 0 | 0.00 |
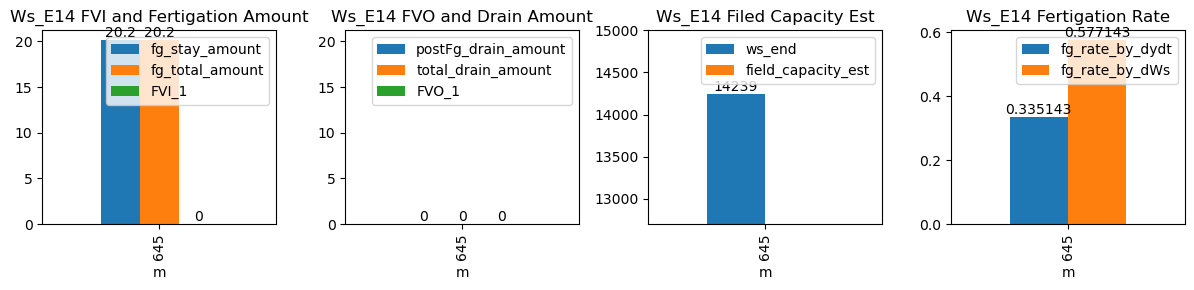
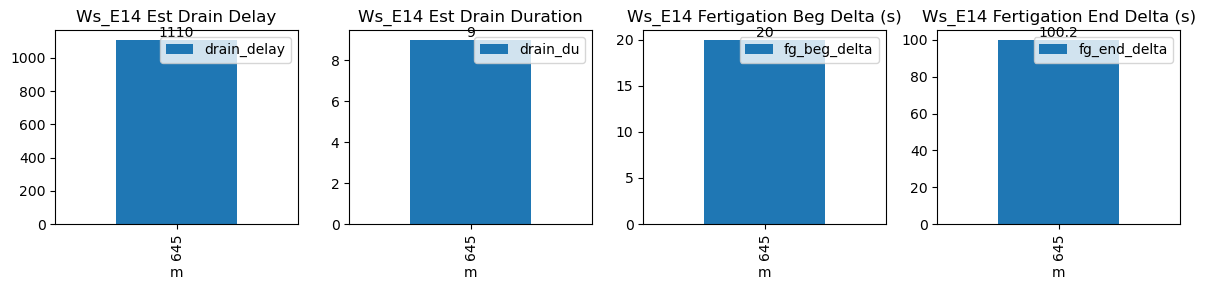
| ds | d | m | ws_name | prominence_cut | max_drain_du | fg_beg | fg_beg_est | fg_end | fg_end_est | ws_beg | ws_end | duc | pre_fg_et | post_fg_ws | post_drn_et | fg_rate_by_dydt | fg_rate_by_dWs | fg_stay_amount | enough_data | fg_beg_delta | fg_end_delta | fg_total_amount | fg_drain_amount | postFg_drain_amount | total_drain_amount | drain_du | drain_delay | drain_rate | field_capacity_est | FVI_1 | FVO_1 |
|---|---|---|---|---|---|---|---|---|---|---|---|---|---|---|---|---|---|---|---|---|---|---|---|---|---|---|---|---|---|---|---|
| 2026-02-01 10:45:00+08:00 | 118 | 645 | Ws_E14 | 0.207309 | 30 | 645.0 | 645.333333 | 645.58 | 647.25 | 14138.0 | 14239.0 | 35 | 0.0 | 0.0 | -0.026944 | 0.344571 | 0.577143 | 20.2 | True | 20.0 | 100.2 | 20.2 | 0.0 | 0 | 0.0 | 9 | 1110 | -0.275919 | NaN | NaN | NaN |