| 2026-02-02 10:20:00+08:00 |
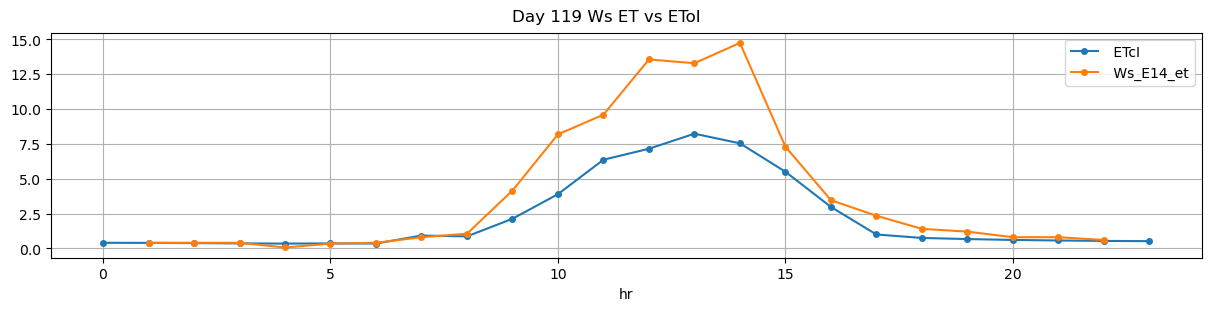
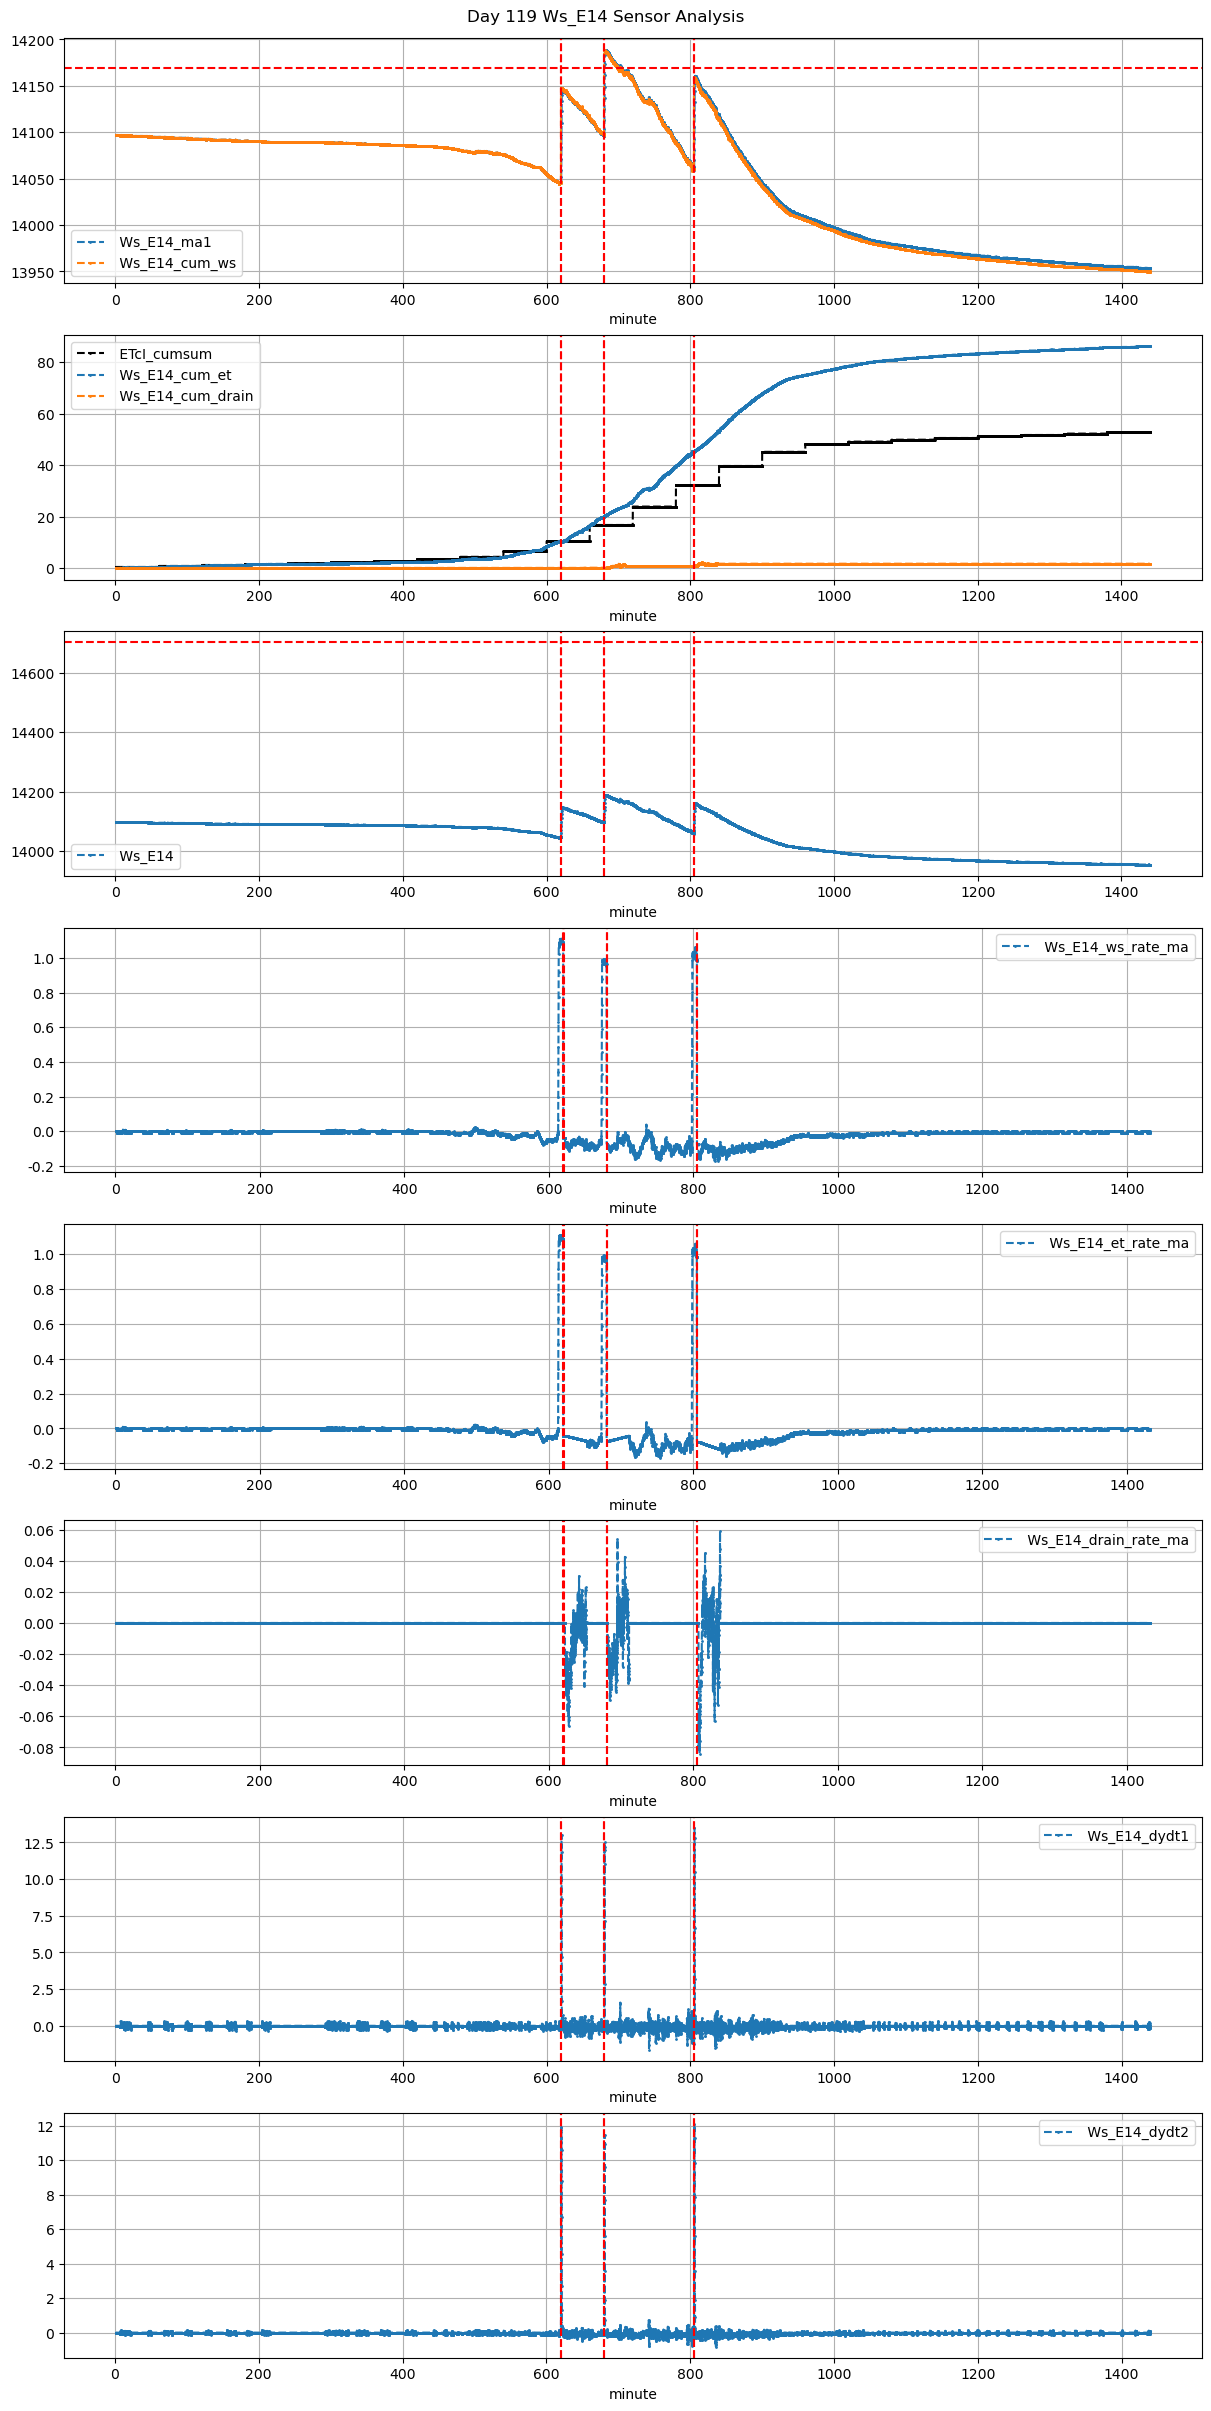
119 |
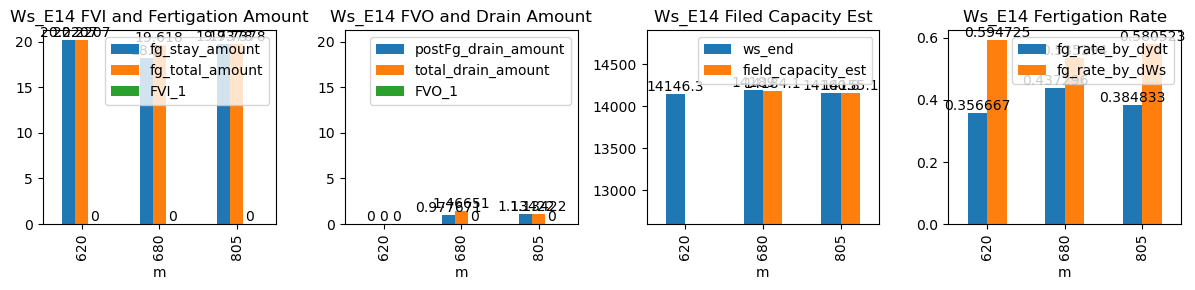
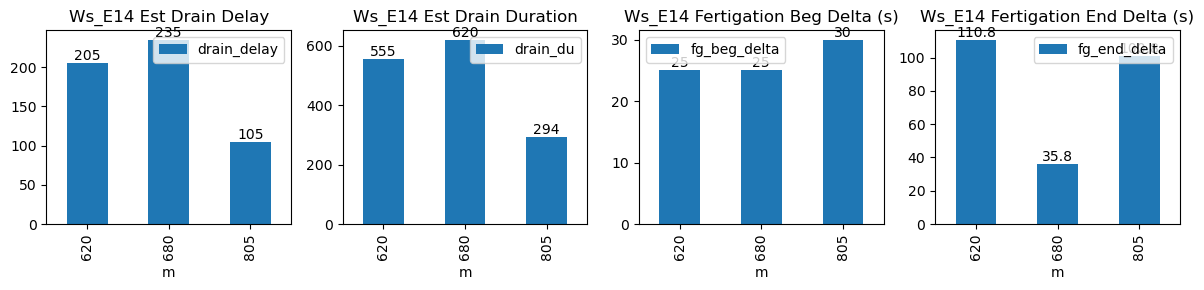
620 |
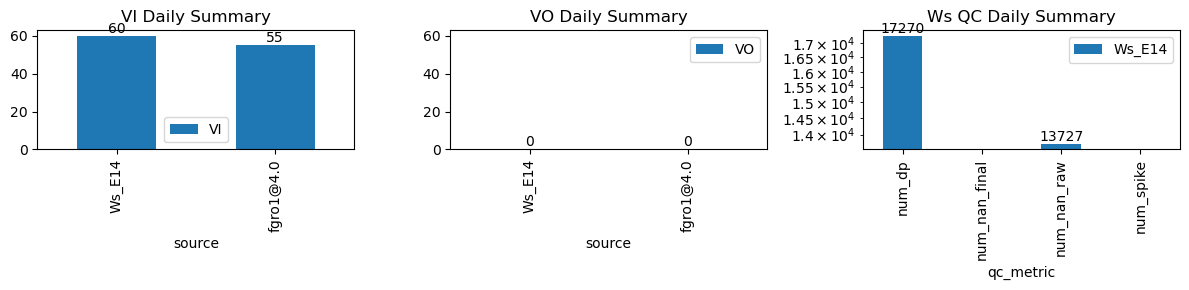
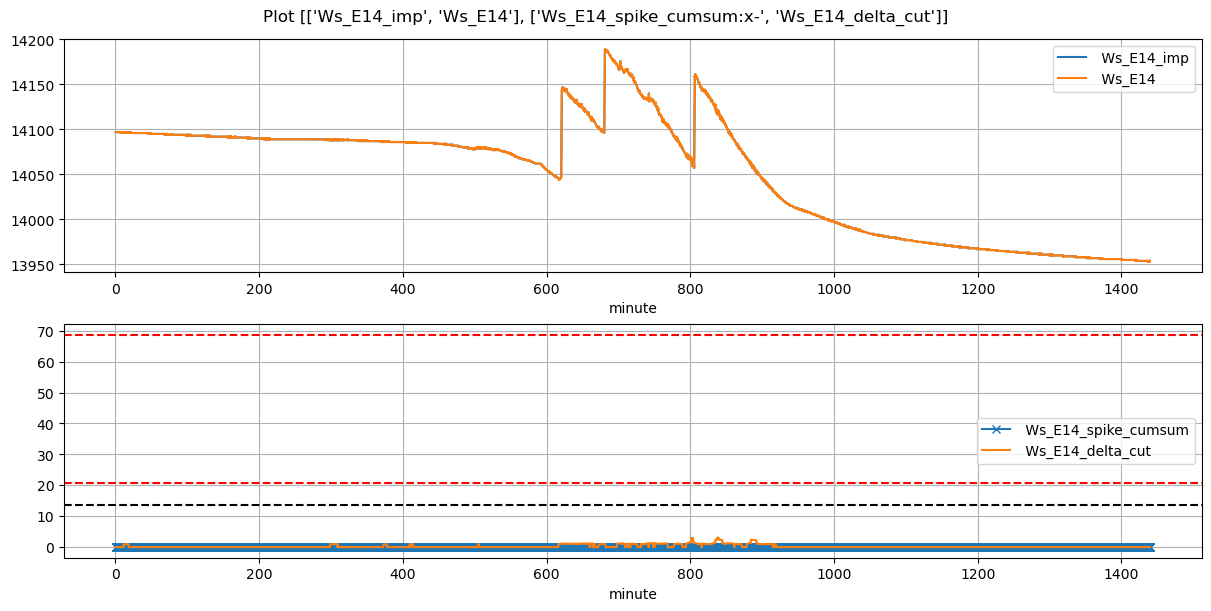
Ws_E14 |
0.340622 |
30 |
620.0 |
620.416667 |
620.57 |
622.333333 |
14045.0 |
14147.0 |
34 |
-0.034361 |
-0.070549 |
-0.073750 |
0.361667 |
0.600000 |
20.40 |
True |
25.0 |
105.8 |
20.400 |
0.0 |
0 |
0.0 |
15 |
335 |
-0.541109 |
NaN |
NaN |
NaN |
| 2026-02-02 11:20:00+08:00 |
119 |
680 |
Ws_E14 |
0.340622 |
30 |
680.0 |
680.416667 |
680.57 |
681.083333 |
14097.6 |
14189.0 |
34 |
-0.056780 |
-0.091574 |
-0.021690 |
0.437926 |
0.537647 |
18.28 |
True |
25.0 |
30.8 |
19.618 |
0.0 |
0 |
0.0 |
9 |
180 |
-0.359764 |
NaN |
NaN |
NaN |
| 2026-02-02 13:25:00+08:00 |
119 |
805 |
Ws_E14 |
0.340622 |
30 |
805.0 |
805.500000 |
805.57 |
806.666667 |
14062.0 |
14161.0 |
34 |
-0.085734 |
-0.151667 |
-0.126528 |
0.430000 |
0.582353 |
19.80 |
True |
30.0 |
65.8 |
19.800 |
0.0 |
0 |
0.0 |
35 |
470 |
-0.594419 |
NaN |
NaN |
NaN |