| 2026-04-01 07:26:29+08:00 |
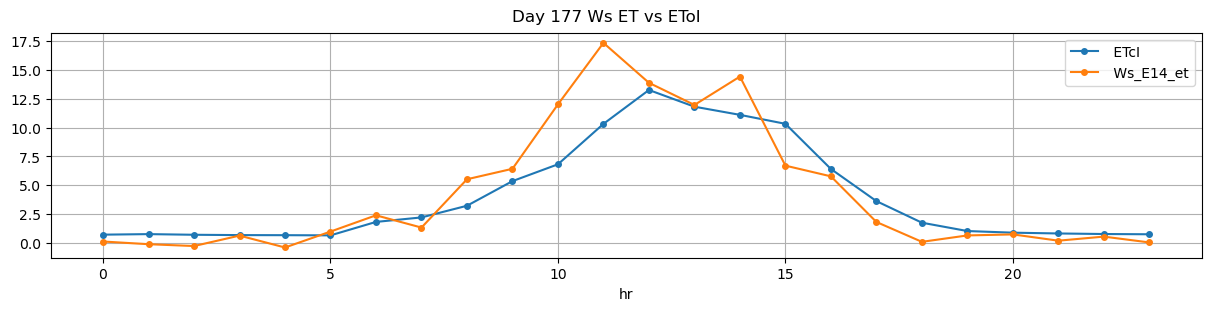
177 |
446 |
Ws_E14 |
0.6931 |
30 |
446.48 |
446.666667 |
447.48 |
448.083333 |
13998.000000 |
14169.0 |
60 |
-0.012292 |
-0.049514 |
-0.015764 |
0.457411 |
0.570000 |
34.200000 |
True |
11.2 |
36.2 |
34.20 |
0.0 |
1.009487 |
1.009487 |
90 |
51 |
-0.181955 |
NaN |
NaN |
NaN |
| 2026-04-01 08:10:00+08:00 |
177 |
490 |
Ws_E14 |
0.6931 |
30 |
490.00 |
490.250000 |
491.00 |
491.500000 |
14153.000000 |
14326.0 |
60 |
-0.051624 |
-0.580613 |
-0.068463 |
0.481444 |
0.576667 |
34.600000 |
True |
15.0 |
30.0 |
34.60 |
0.0 |
15.304198 |
15.304198 |
735 |
94 |
-0.747208 |
14249.479008 |
NaN |
NaN |
| 2026-04-01 08:55:00+08:00 |
177 |
535 |
Ws_E14 |
0.6931 |
30 |
535.00 |
535.250000 |
536.00 |
536.500000 |
14225.177143 |
14385.0 |
60 |
0.000000 |
-0.878704 |
-0.063843 |
0.444028 |
0.532743 |
31.964571 |
True |
15.0 |
30.0 |
34.08 |
2.1 |
26.826744 |
28.926744 |
1194 |
45 |
-1.552853 |
14250.866279 |
NaN |
NaN |
| 2026-04-01 13:05:00+08:00 |
177 |
785 |
Ws_E14 |
0.6931 |
30 |
785.00 |
785.250000 |
786.00 |
787.583333 |
13987.300000 |
14153.0 |
60 |
-0.200447 |
-0.027789 |
-0.025671 |
0.407833 |
0.552333 |
33.140000 |
True |
15.0 |
95.0 |
34.08 |
0.0 |
0.000000 |
0.000000 |
54 |
365 |
-0.689687 |
NaN |
NaN |
NaN |
| 2026-04-01 15:25:00+08:00 |
177 |
925 |
Ws_E14 |
0.6931 |
30 |
925.00 |
925.333333 |
926.00 |
926.500000 |
14016.466667 |
14178.0 |
60 |
-0.008752 |
-0.043137 |
0.000000 |
0.455789 |
0.538444 |
32.306667 |
True |
20.0 |
30.0 |
34.08 |
0.0 |
0.000000 |
0.000000 |
10 |
339 |
-0.533999 |
NaN |
NaN |
NaN |