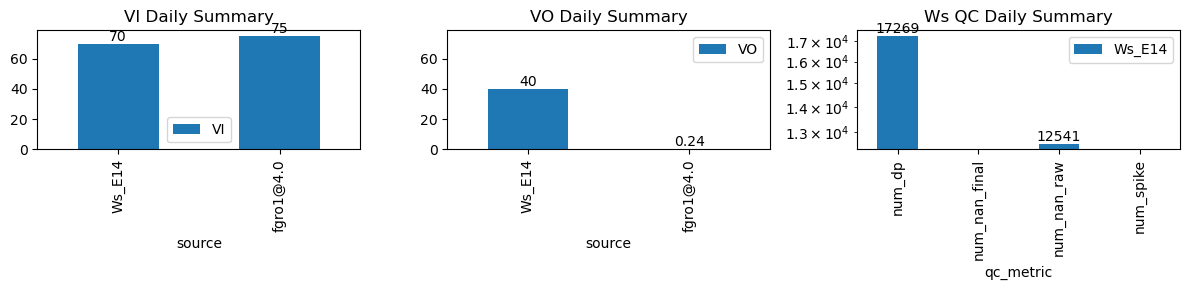
VI and VO Daily Summary
| ws_name | num_dp | num_nan_raw | num_nan_final | num_spike | cum_step_adj |
|---|---|---|---|---|---|
| Ws_E14 | 17,269 | 12,541 | 0 | 0 | 0.00 |
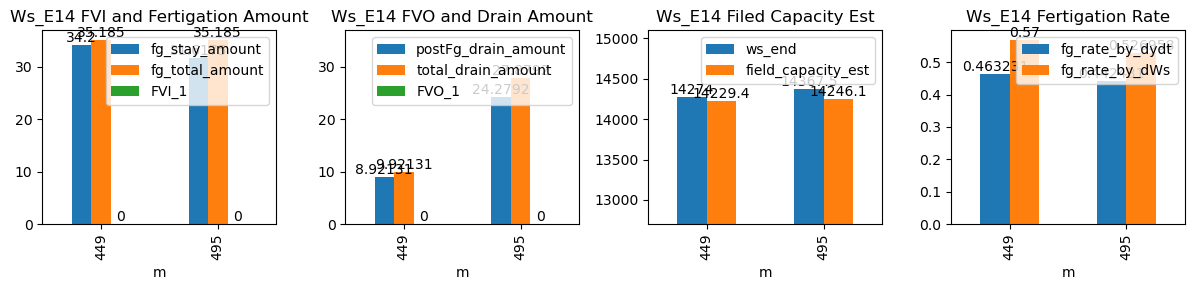
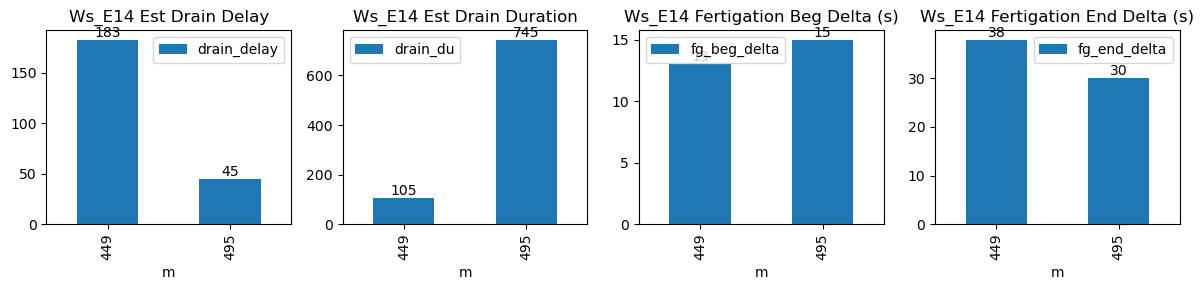
| ds | d | m | ws_name | prominence_cut | max_drain_du | fg_beg | fg_beg_est | fg_end | fg_end_est | ws_beg | ws_end | duc | pre_fg_et | post_fg_ws | post_drn_et | fg_rate_by_dydt | fg_rate_by_dWs | fg_stay_amount | enough_data | fg_beg_delta | fg_end_delta | fg_total_amount | fg_drain_amount | postFg_drain_amount | total_drain_amount | drain_du | drain_delay | drain_rate | field_capacity_est | FVI_1 | FVO_1 |
|---|---|---|---|---|---|---|---|---|---|---|---|---|---|---|---|---|---|---|---|---|---|---|---|---|---|---|---|---|---|---|---|
| 2026-03-31 07:29:27+08:00 | 176 | 449 | Ws_E14 | 0.537454 | 30 | 449.45 | 449.666667 | 450.45 | 451.083333 | 14103.000000 | 14274.0 | 60 | -0.039884 | -0.335759 | -0.030278 | 0.463231 | 0.570000 | 34.20000 | True | 13.0 | 38.0 | 35.185 | 1.0 | 8.921311 | 9.921311 | 105 | 183 | -0.510872 | 14229.393443 | NaN | NaN |
| 2026-03-31 08:15:00+08:00 | 176 | 495 | Ws_E14 | 0.537454 | 30 | 495.00 | 495.250000 | 496.00 | 496.500000 | 14209.412698 | 14367.5 | 60 | -0.030041 | -0.892199 | -0.071505 | 0.442431 | 0.526958 | 31.61746 | True | 15.0 | 30.0 | 35.185 | 3.6 | 24.279151 | 27.879151 | 745 | 45 | -1.567447 | 14246.104245 | NaN | NaN |