| 2026-03-30 07:26:29+08:00 |
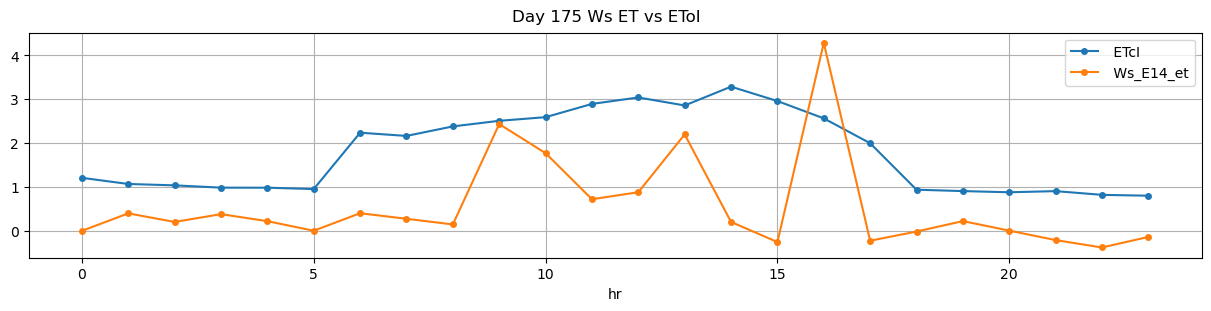
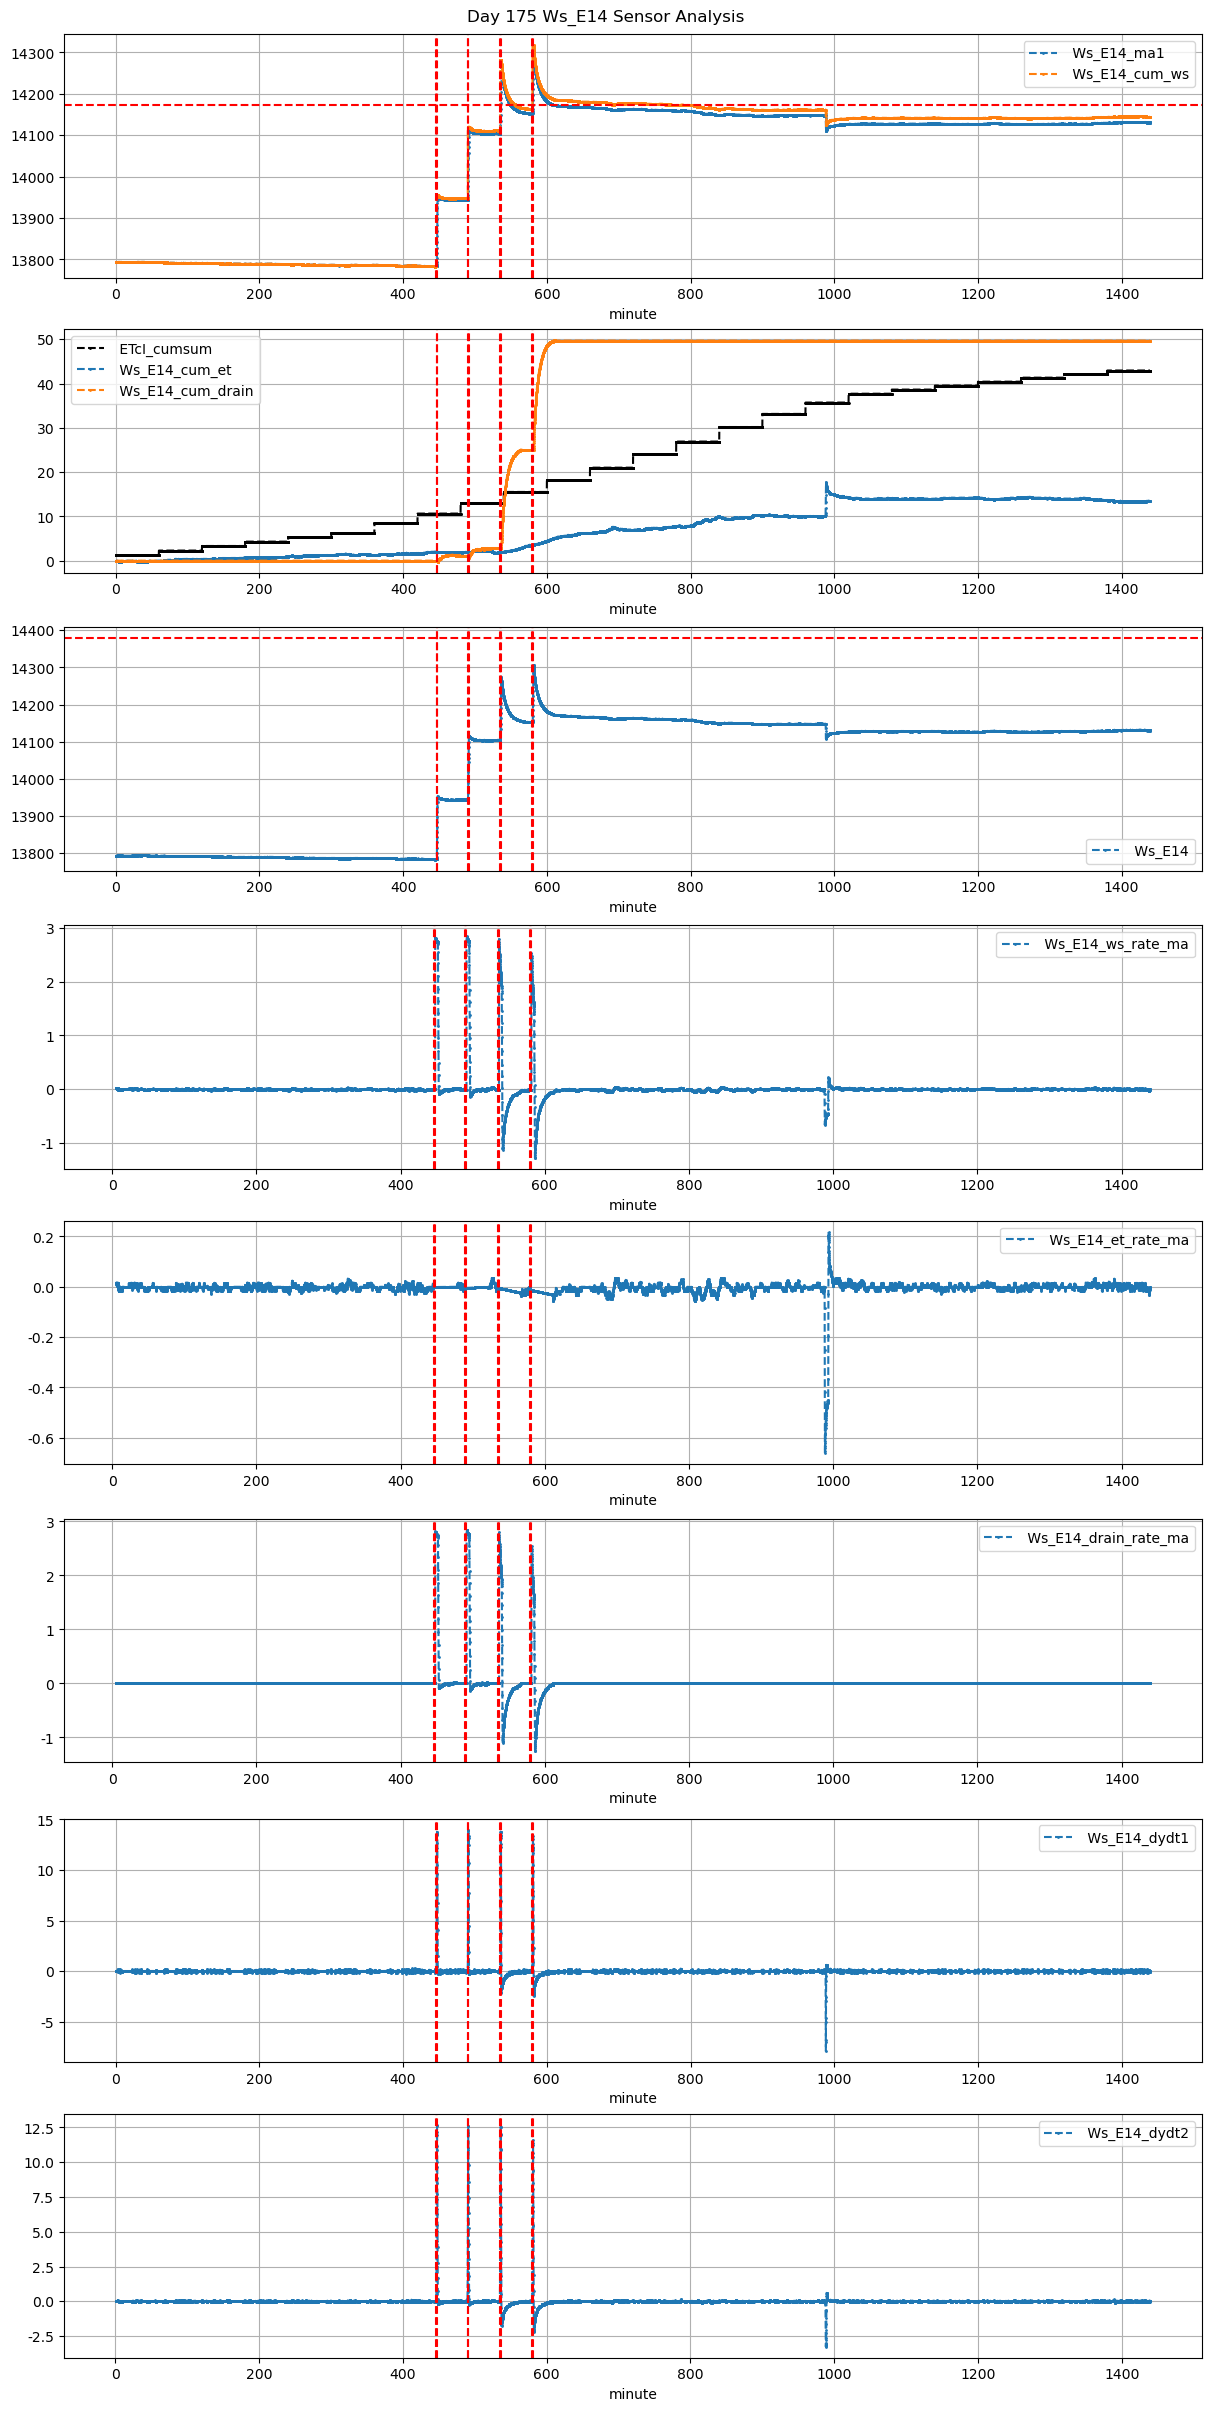
175 |
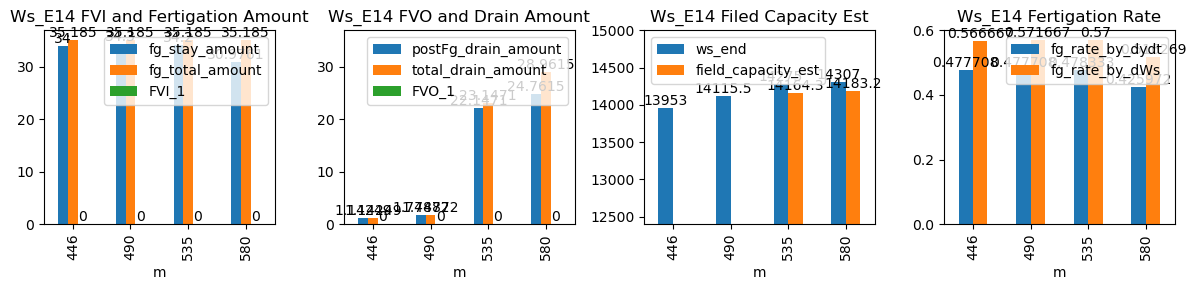
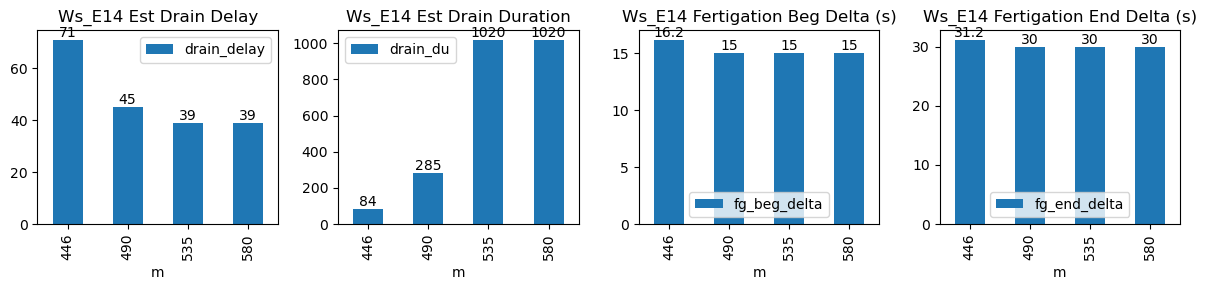
446 |
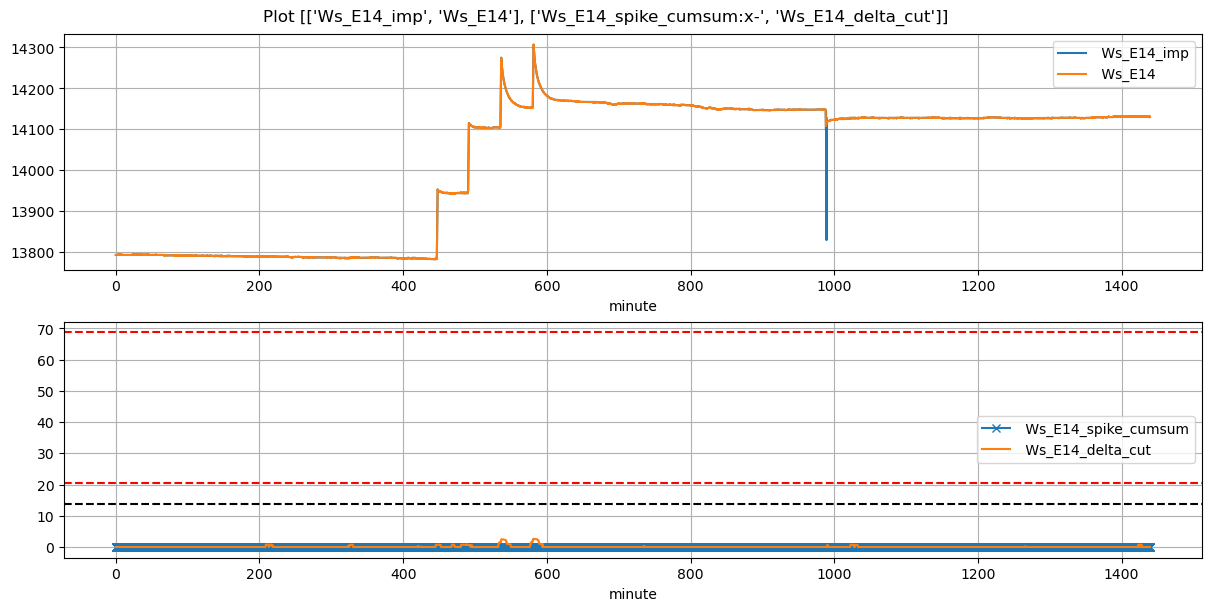
Ws_E14 |
0.678175 |
30 |
446.48 |
446.75 |
447.48 |
448.0 |
13783.000000 |
13953.0 |
60 |
-0.000955 |
-0.056424 |
0.000000 |
0.477708 |
0.566667 |
34.000000 |
True |
16.2 |
31.2 |
35.185 |
0.0 |
1.142491 |
1.142491 |
84 |
71 |
-0.196085 |
NaN |
NaN |
NaN |
| 2026-03-30 08:10:00+08:00 |
175 |
490 |
Ws_E14 |
0.678175 |
30 |
490.00 |
490.25 |
491.00 |
491.5 |
13944.000000 |
14115.5 |
60 |
-0.004483 |
-0.078241 |
0.000000 |
0.477708 |
0.571667 |
34.300000 |
True |
15.0 |
30.0 |
35.185 |
0.0 |
1.748721 |
1.748721 |
285 |
45 |
-0.197817 |
NaN |
NaN |
NaN |
| 2026-03-30 08:55:00+08:00 |
175 |
535 |
Ws_E14 |
0.678175 |
30 |
535.00 |
535.25 |
536.00 |
536.5 |
14104.000000 |
14275.0 |
60 |
-0.005014 |
-0.699005 |
-0.023465 |
0.478333 |
0.570000 |
34.200000 |
True |
15.0 |
30.0 |
35.185 |
1.0 |
22.147109 |
23.147109 |
1020 |
39 |
-1.269048 |
14164.264457 |
NaN |
NaN |
| 2026-03-30 09:40:00+08:00 |
175 |
580 |
Ws_E14 |
0.678175 |
30 |
580.00 |
580.25 |
581.00 |
581.5 |
14152.119444 |
14307.0 |
60 |
-0.013711 |
-0.755671 |
-0.031250 |
0.425972 |
0.516269 |
30.976111 |
True |
15.0 |
30.0 |
35.185 |
4.2 |
24.761494 |
28.961494 |
1020 |
39 |
-1.365468 |
14183.192530 |
NaN |
NaN |