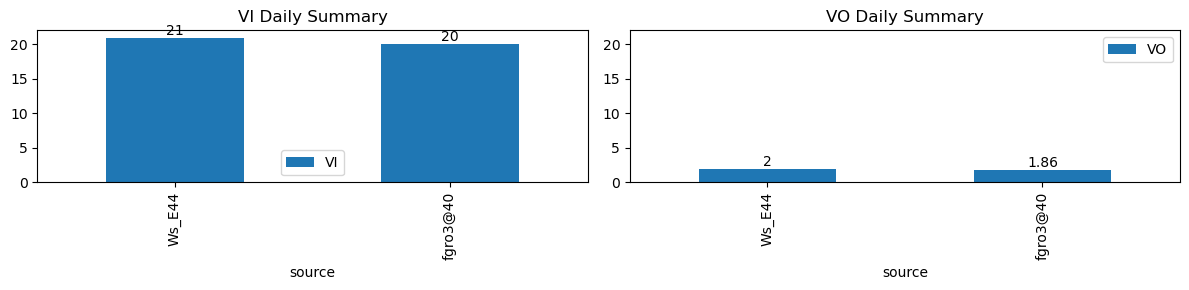
VI and VO Daily Summary
| ws_name | total_dp | nan_dp | nan_filled_dp | long_gap_dp | num_spike |
|---|---|---|---|---|---|
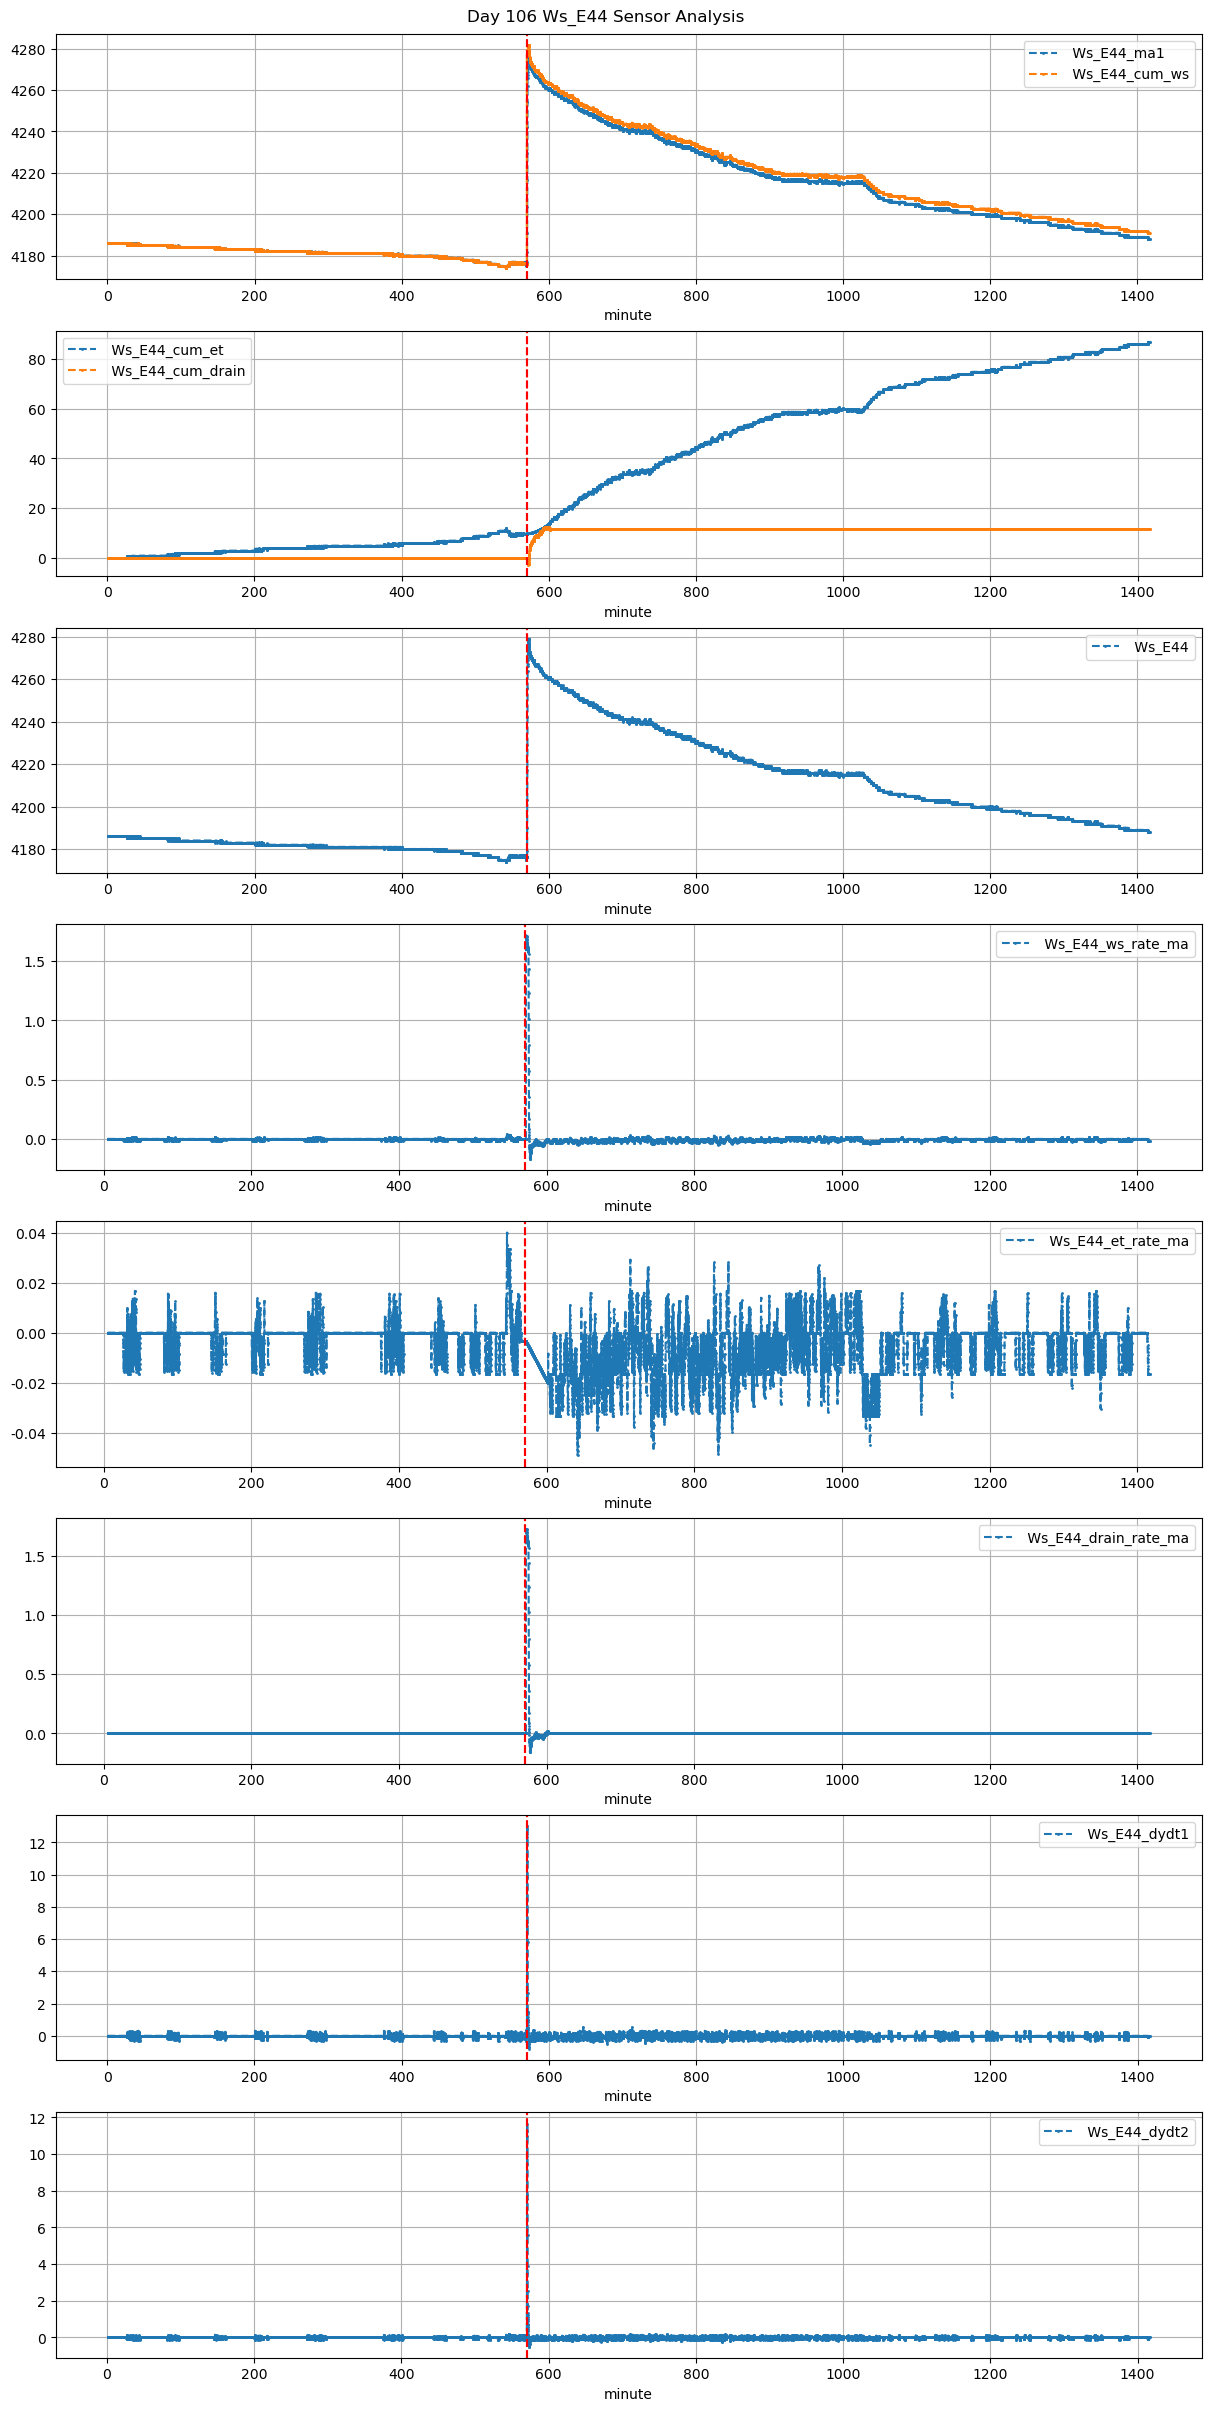
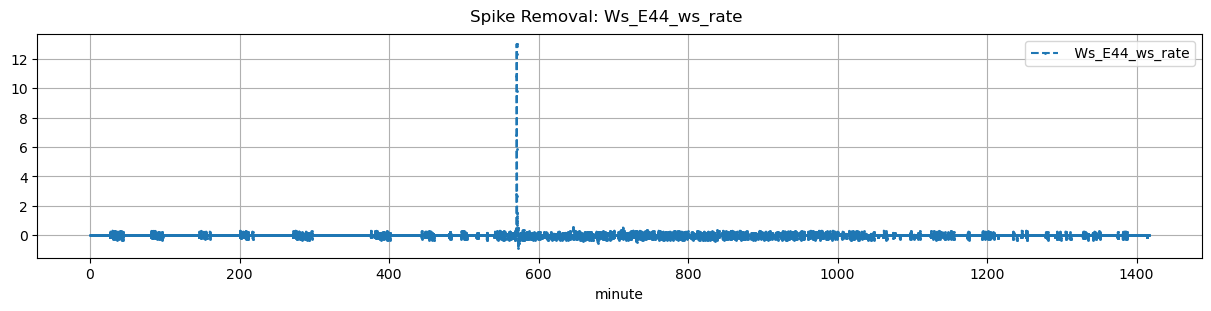
| Ws_E44 | 16995 | 0 | 13939 | 0 | 0 |
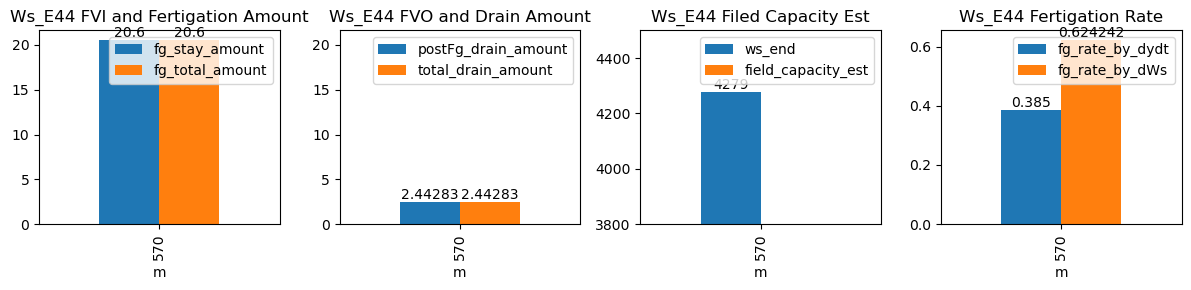
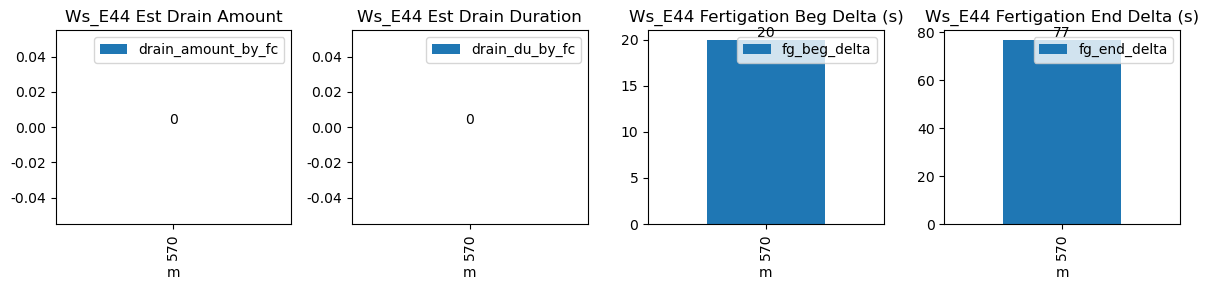
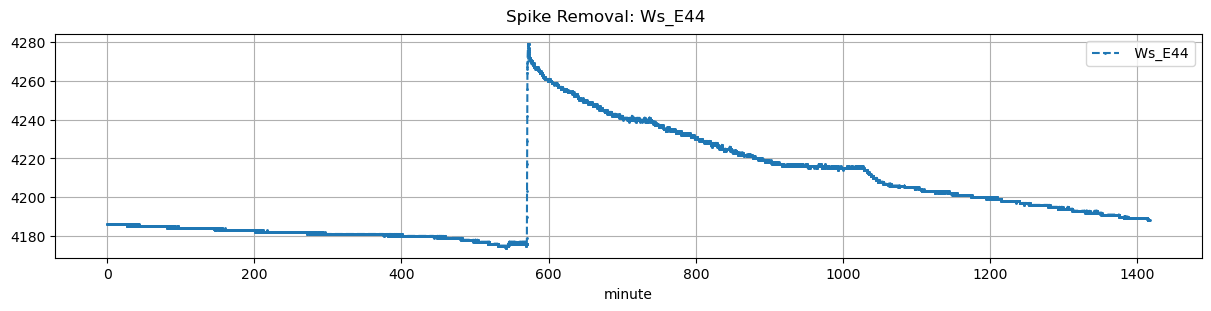
| ds | d | m | ws_name | prominence_cut | max_drain_du | fg_beg | fg_beg_est | fg_end | fg_end_est | drain_amount_by_fc | drain_du_by_fc | drain_rate_by_fc | ws_beg | ws_end | duc | pre_fg_et | post_fg_ws | post_drn_et | fg_rate_by_dydt | fg_rate_by_dWs | fg_stay_amount | fg_beg_delta | fg_end_delta | fg_total_amount | fg_drain_amount | postFg_drain_amount | field_capacity_est | total_drain_amount |
|---|---|---|---|---|---|---|---|---|---|---|---|---|---|---|---|---|---|---|---|---|---|---|---|---|---|---|---|---|
| 2026-01-20 09:30:00+08:00 | 106 | 570 | Ws_E44 | 0.187587 | 30 | 570.0 | 570.333333 | 570.55 | 571.833333 | NaN | NaN | NaN | 4176.0 | 4279.0 | 33 | -0.003442 | -0.084167 | -0.020278 | 0.385 | 0.624242 | 20.6 | 20.0 | 77.0 | 20.6 | 0.0 | 2.442828 | NaN | 2.442828 |