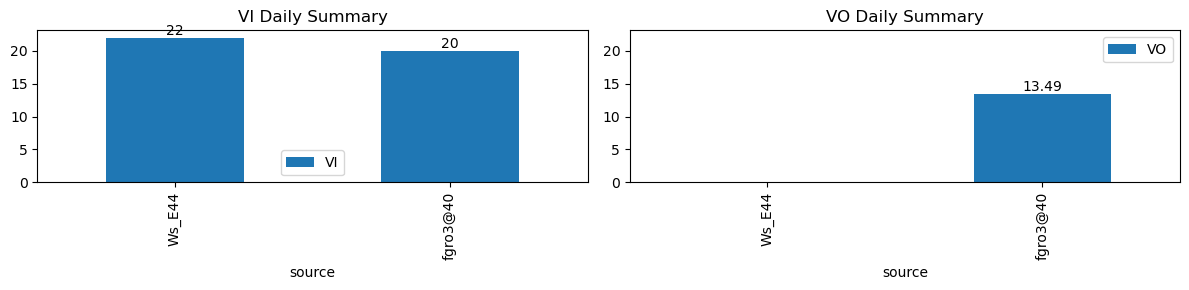
VI and VO Daily Summary
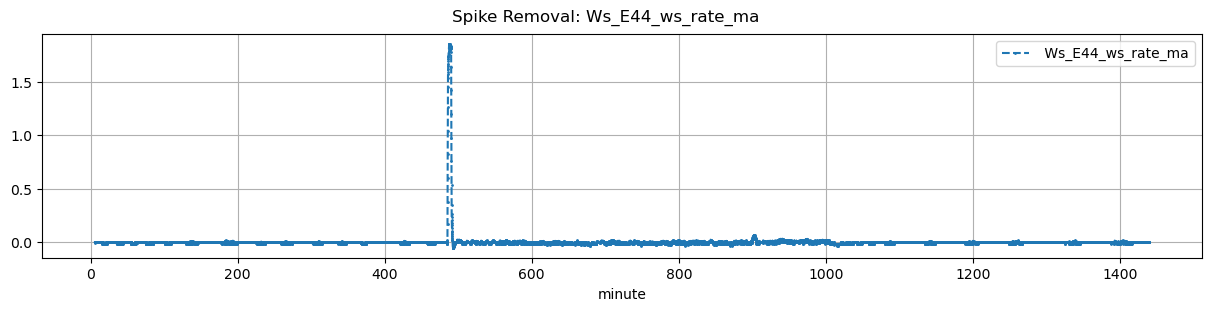
| ws_name | total_dp | nan_dp | nan_filled_dp | long_gap_dp | num_spike |
|---|---|---|---|---|---|
| Ws_E44 | 17265 | 0 | 14415 | 0 | 0 |
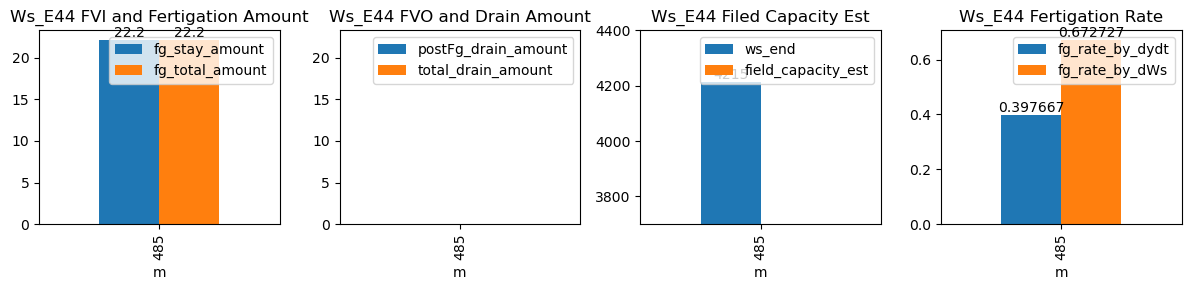
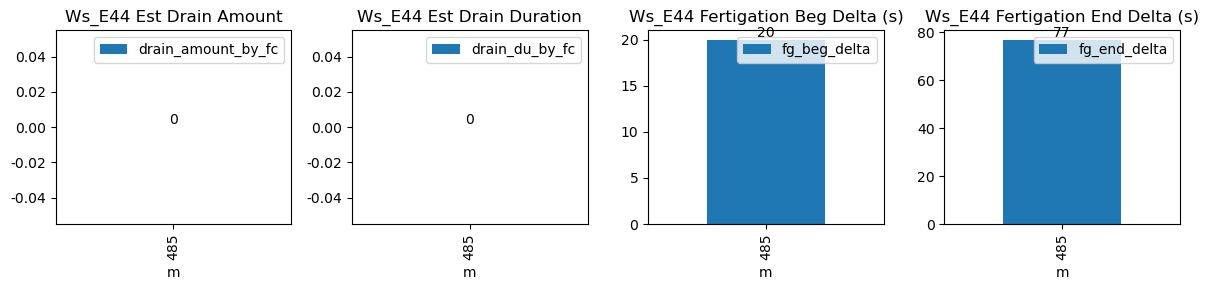
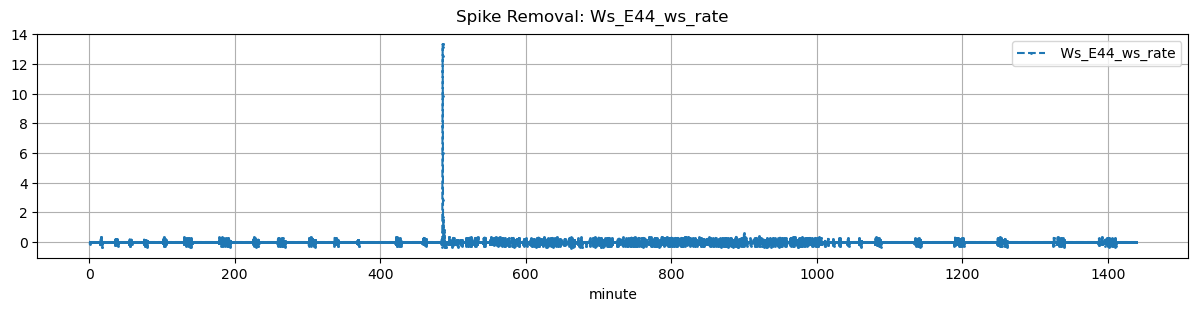
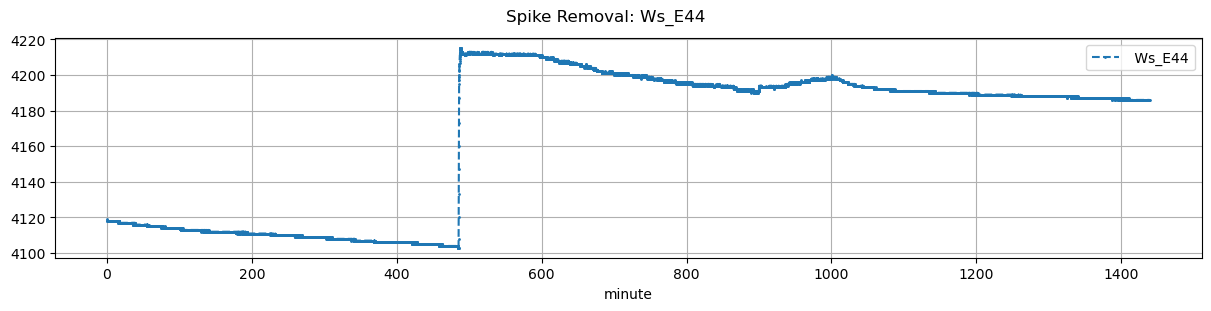
| ds | d | m | ws_name | prominence_cut | max_drain_du | fg_beg | fg_beg_est | fg_end | fg_end_est | drain_amount_by_fc | drain_du_by_fc | drain_rate_by_fc | ws_beg | ws_end | duc | pre_fg_et | post_fg_ws | post_drn_et | fg_rate_by_dydt | fg_rate_by_dWs | fg_stay_amount | fg_beg_delta | fg_end_delta | fg_total_amount | fg_drain_amount | postFg_drain_amount | field_capacity_est | total_drain_amount |
|---|---|---|---|---|---|---|---|---|---|---|---|---|---|---|---|---|---|---|---|---|---|---|---|---|---|---|---|---|
| 2026-01-19 08:05:00+08:00 | 105 | 485 | Ws_E44 | 0.155766 | 30 | 485.0 | 485.333333 | 485.55 | 486.833333 | NaN | NaN | NaN | 4104.0 | 4215.0 | 33 | -0.000989 | -0.016389 | 0.0 | 0.397667 | 0.672727 | 22.2 | 20.0 | 77.0 | 22.2 | 0.0 | -0.735444 | NaN | -0.735444 |