| 2026-01-09 10:46:05+08:00 |
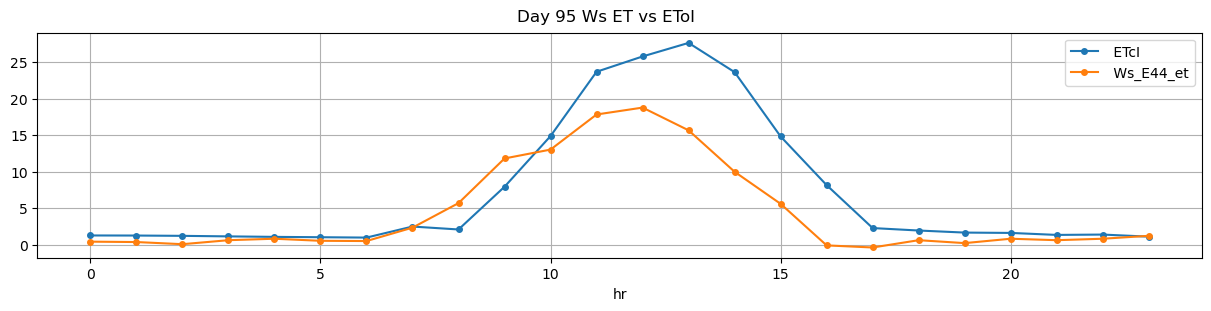
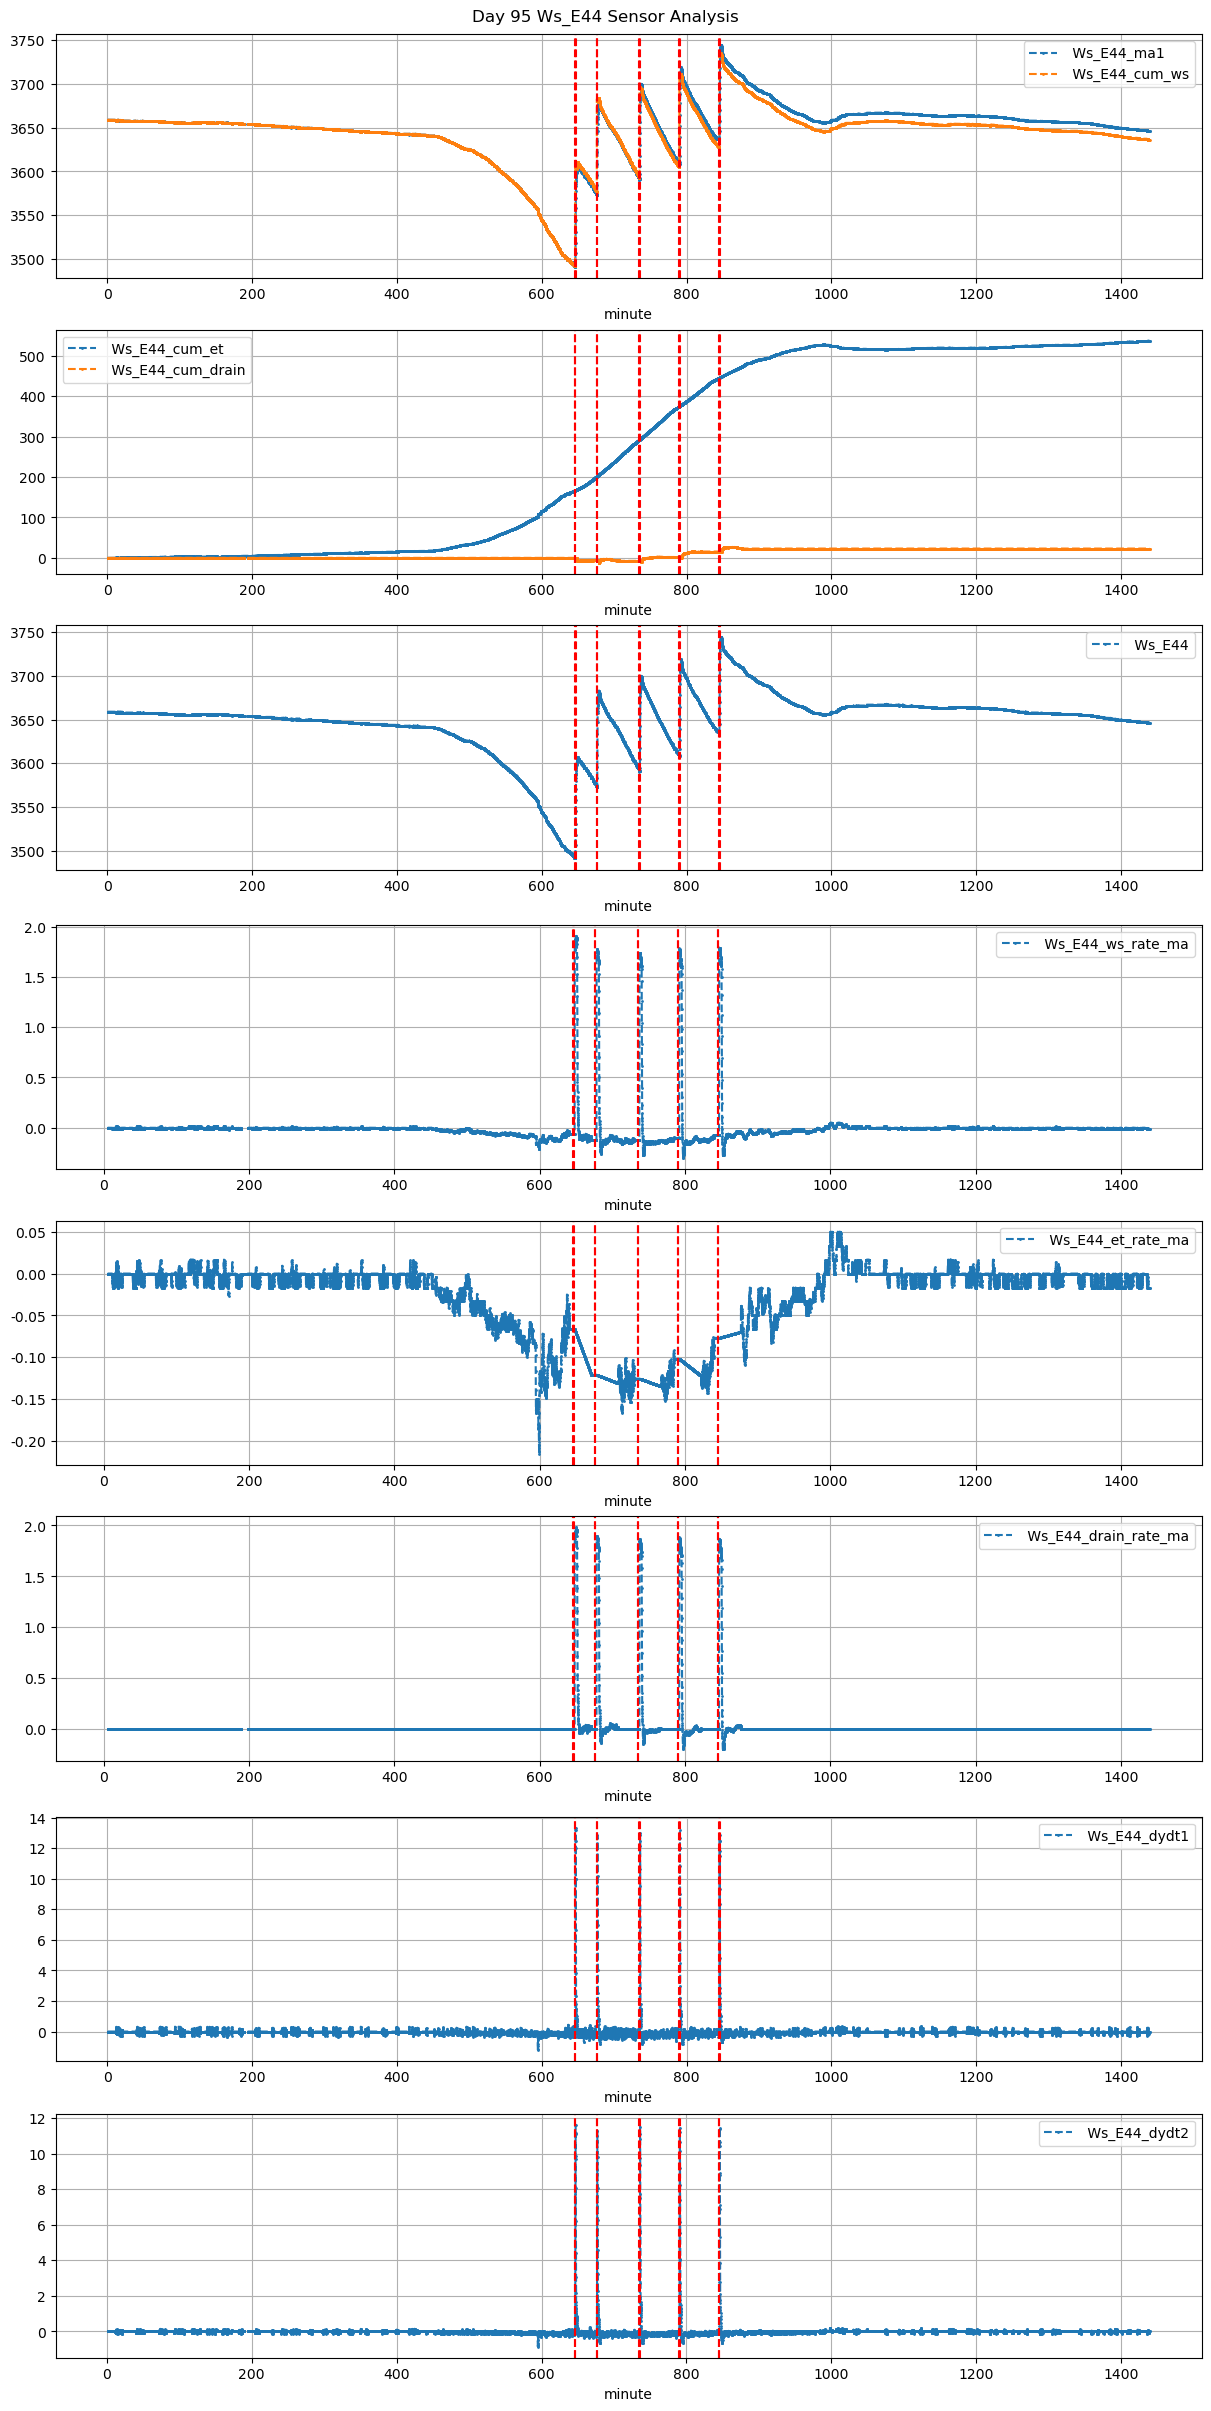
95 |
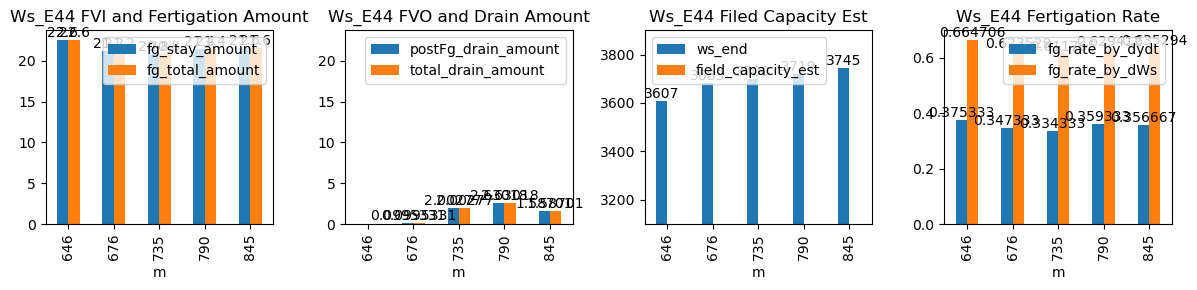
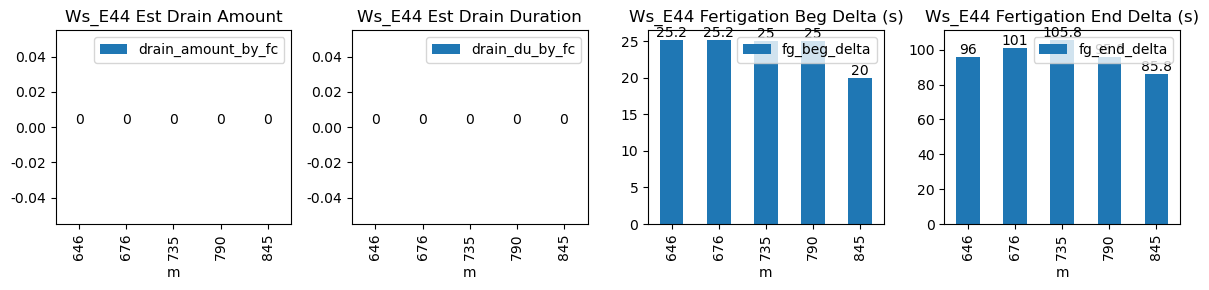
646 |
Ws_E44 |
0.35338 |
27.75 |
646.08 |
646.500000 |
646.65 |
648.250000 |
NaN |
NaN |
NaN |
3494.0 |
3607.0 |
34 |
-0.066548 |
-0.080972 |
0.000000 |
0.375333 |
0.664706 |
22.6 |
25.2 |
96.0 |
22.6 |
0.0 |
-1.270702 |
NaN |
-1.270702 |
| 2026-01-09 11:16:05+08:00 |
95 |
676 |
Ws_E44 |
0.35338 |
30.00 |
676.08 |
676.500000 |
676.65 |
678.333333 |
NaN |
NaN |
NaN |
3577.0 |
3683.0 |
34 |
-0.120774 |
-0.178611 |
-0.131000 |
0.347333 |
0.623529 |
21.2 |
25.2 |
101.0 |
21.2 |
0.0 |
0.099533 |
NaN |
0.099533 |
| 2026-01-09 12:15:00+08:00 |
95 |
735 |
Ws_E44 |
0.35338 |
30.00 |
735.00 |
735.416667 |
735.57 |
737.333333 |
NaN |
NaN |
NaN |
3596.0 |
3700.0 |
34 |
-0.125317 |
-0.183889 |
-0.134722 |
0.334333 |
0.611765 |
20.8 |
25.0 |
105.8 |
20.8 |
0.0 |
2.002771 |
NaN |
2.002771 |
| 2026-01-09 13:10:00+08:00 |
95 |
790 |
Ws_E44 |
0.35338 |
30.00 |
790.00 |
790.416667 |
790.57 |
792.166667 |
NaN |
NaN |
NaN |
3612.0 |
3719.0 |
34 |
-0.101748 |
-0.190833 |
-0.122140 |
0.359333 |
0.629412 |
21.4 |
25.0 |
95.8 |
21.4 |
0.0 |
2.630175 |
NaN |
2.630175 |
| 2026-01-09 14:05:00+08:00 |
95 |
845 |
Ws_E44 |
0.35338 |
30.00 |
845.00 |
845.333333 |
845.57 |
847.000000 |
NaN |
NaN |
NaN |
3637.0 |
3745.0 |
34 |
-0.076824 |
-0.174028 |
-0.069549 |
0.356667 |
0.635294 |
21.6 |
20.0 |
85.8 |
21.6 |
0.0 |
1.587009 |
NaN |
1.587009 |