| 2026-01-08 11:01:05+08:00 |
94 |
661 |
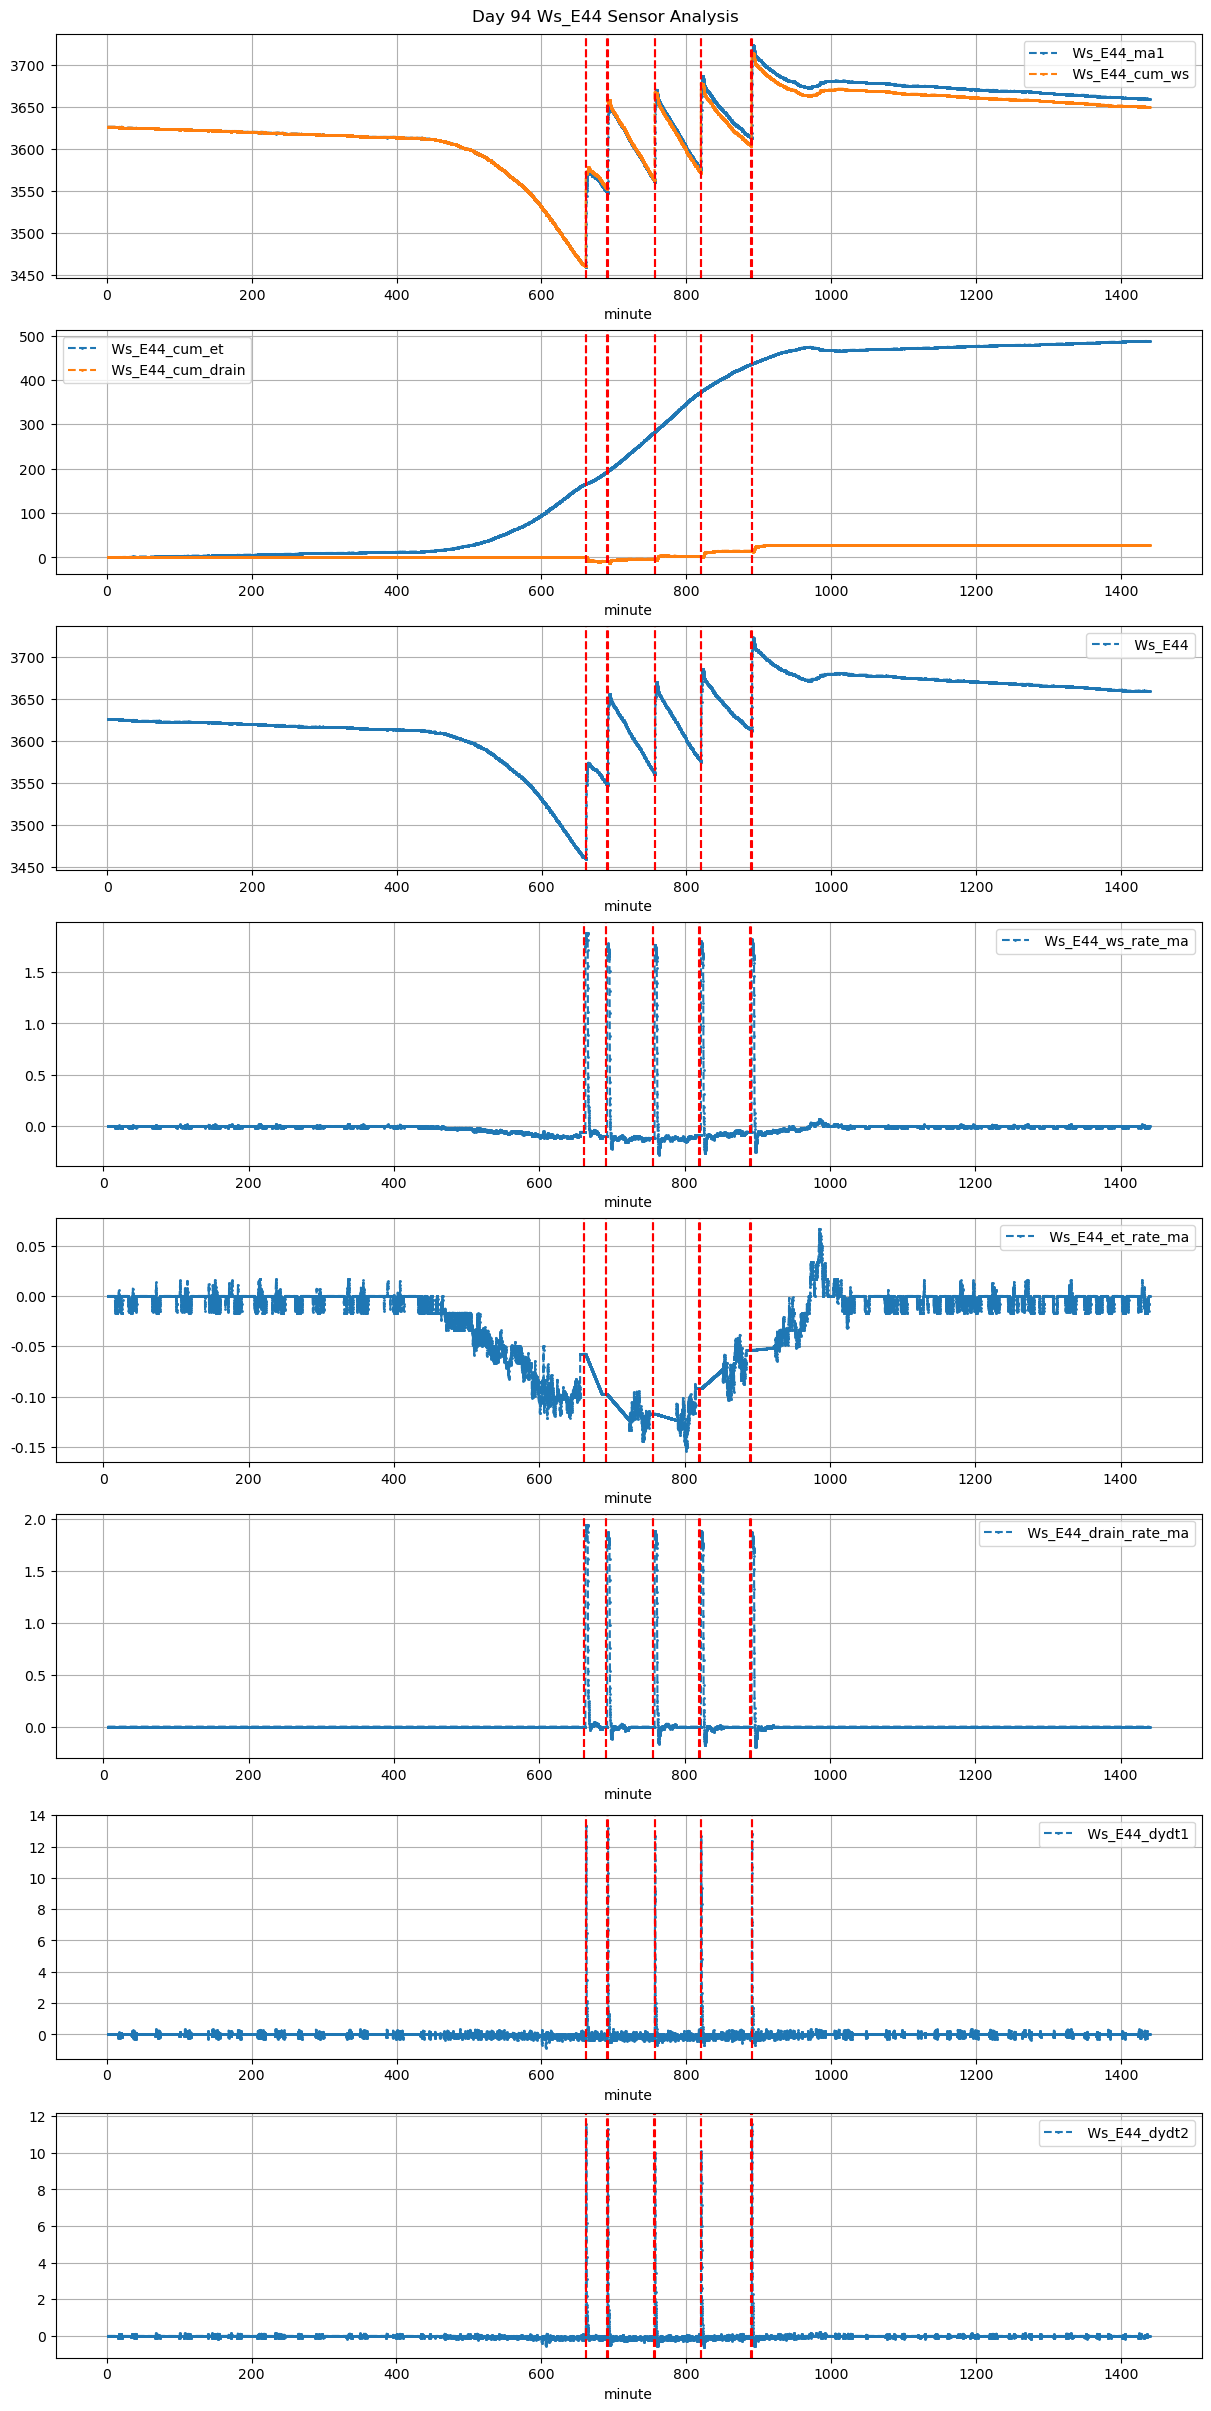
Ws_E44 |
0.329011 |
27.666667 |
661.08 |
661.500000 |
661.65 |
663.333333 |
NaN |
NaN |
NaN |
3462.125 |
3574.0 |
34 |
-0.069654 |
-0.057500 |
0.000000 |
0.355000 |
0.658088 |
22.375 |
25.2 |
101.0 |
22.375 |
0.0 |
-1.624944 |
NaN |
-1.624944 |
| 2026-01-08 11:31:05+08:00 |
94 |
691 |
Ws_E44 |
0.329011 |
30.000000 |
691.08 |
691.500000 |
691.65 |
693.333333 |
NaN |
NaN |
NaN |
3551.000 |
3656.0 |
34 |
-0.097870 |
-0.150000 |
-0.123065 |
0.343000 |
0.617647 |
21.000 |
25.2 |
101.0 |
21.000 |
0.0 |
1.016883 |
NaN |
1.016883 |
| 2026-01-08 12:36:09+08:00 |
94 |
756 |
Ws_E44 |
0.329011 |
30.000000 |
756.15 |
756.500000 |
756.72 |
758.583333 |
NaN |
NaN |
NaN |
3565.000 |
3670.0 |
34 |
-0.116833 |
-0.187083 |
-0.123372 |
0.316667 |
0.617647 |
21.000 |
21.0 |
111.8 |
21.000 |
0.0 |
1.114381 |
NaN |
1.114381 |
| 2026-01-08 13:40:00+08:00 |
94 |
820 |
Ws_E44 |
0.329011 |
30.000000 |
820.00 |
820.333333 |
820.57 |
822.416667 |
NaN |
NaN |
NaN |
3579.000 |
3686.0 |
34 |
-0.091949 |
-0.159444 |
-0.072667 |
0.321667 |
0.629412 |
21.400 |
20.0 |
110.8 |
21.400 |
0.0 |
2.381478 |
NaN |
2.381478 |
| 2026-01-08 14:50:00+08:00 |
94 |
890 |
Ws_E44 |
0.329011 |
30.000000 |
890.00 |
890.416667 |
890.57 |
892.166667 |
NaN |
NaN |
NaN |
3614.000 |
3724.0 |
34 |
-0.053704 |
-0.137222 |
-0.051528 |
0.370000 |
0.647059 |
22.000 |
25.0 |
95.8 |
22.000 |
0.0 |
2.530681 |
NaN |
2.530681 |