| 2026-01-07 08:55:00+08:00 |
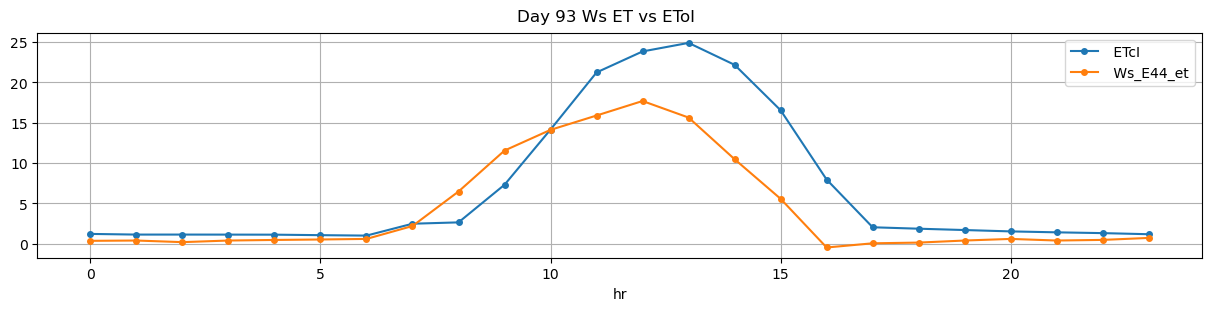
93 |
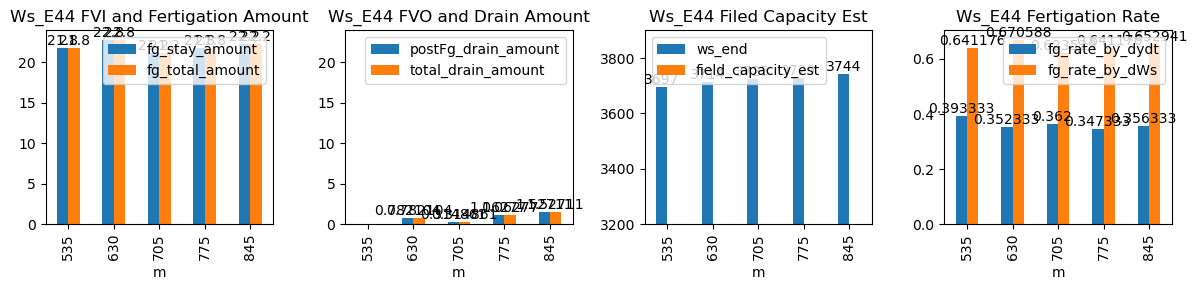
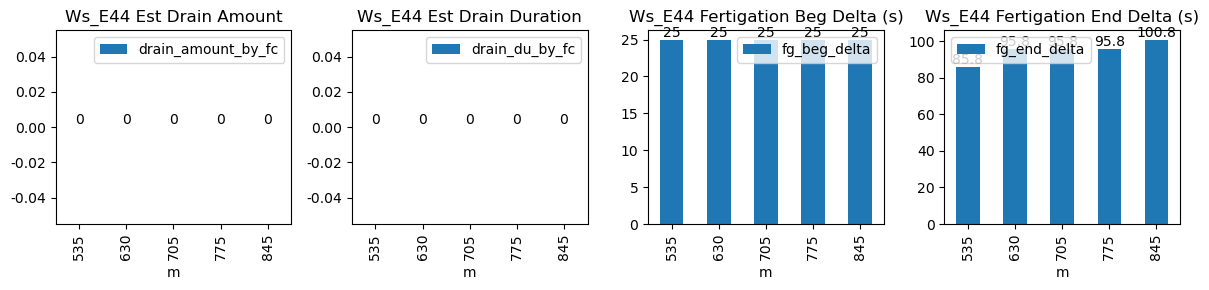
535 |
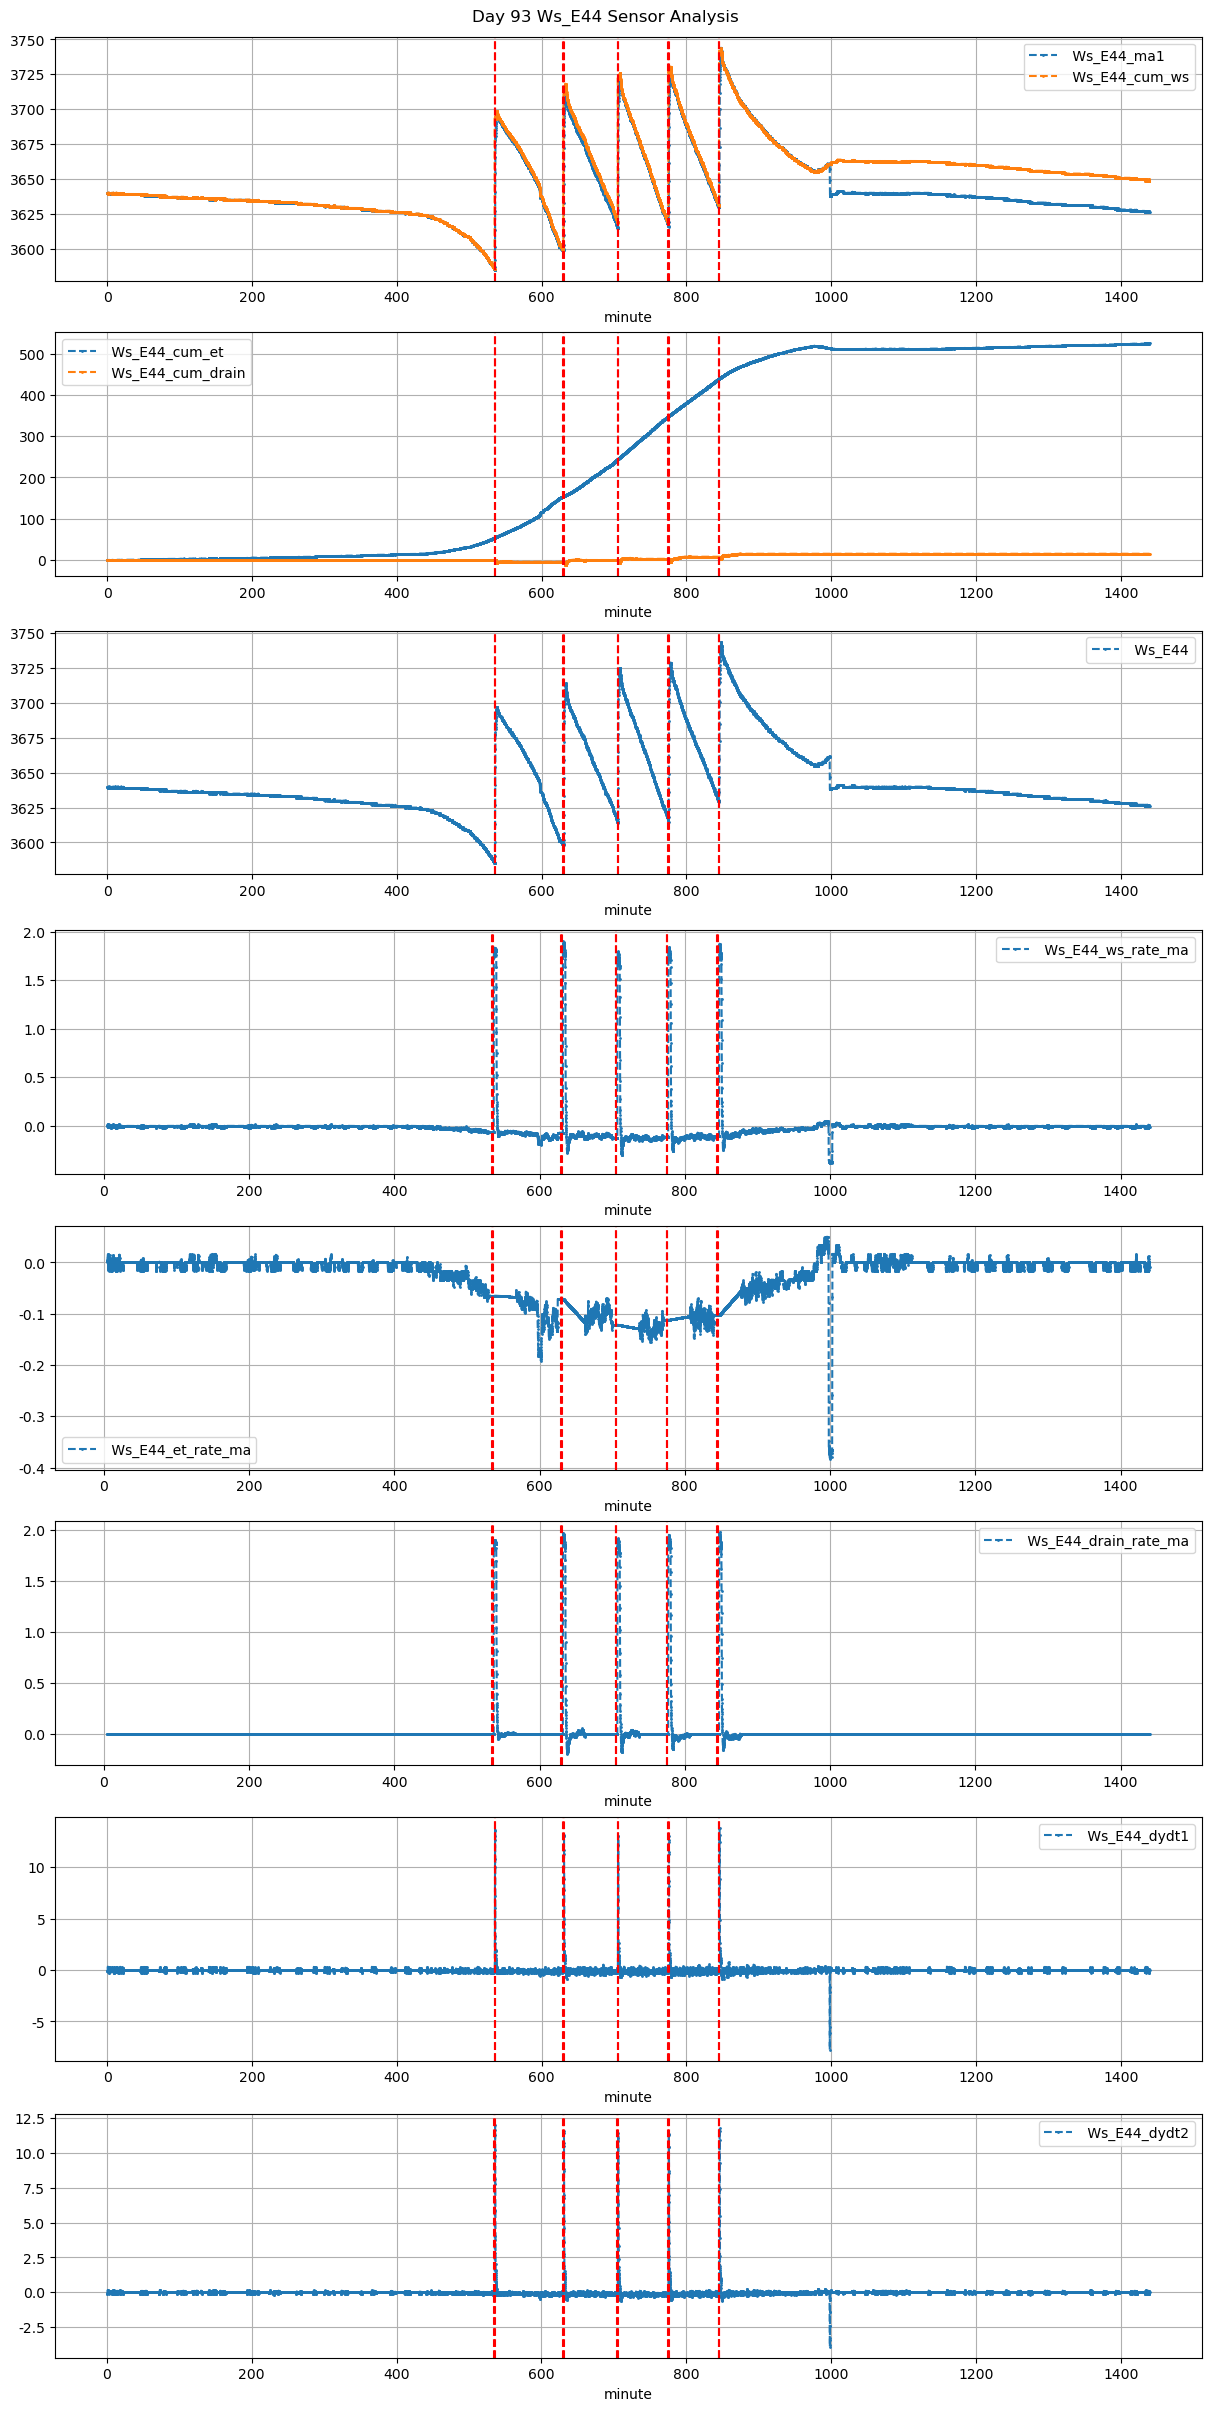
Ws_E44 |
0.479175 |
30 |
535.0 |
535.416667 |
535.57 |
537.000000 |
NaN |
NaN |
NaN |
3588.0 |
3697.0 |
34 |
-0.064654 |
-0.075000 |
-0.067064 |
0.393333 |
0.641176 |
21.8 |
25.0 |
85.8 |
21.8 |
0.0 |
-0.827425 |
NaN |
-0.827425 |
| 2026-01-07 10:30:00+08:00 |
93 |
630 |
Ws_E44 |
0.479175 |
30 |
630.0 |
630.416667 |
630.57 |
632.166667 |
NaN |
NaN |
NaN |
3600.0 |
3714.0 |
34 |
-0.070421 |
-0.182917 |
-0.116616 |
0.352333 |
0.670588 |
22.8 |
25.0 |
95.8 |
22.8 |
0.0 |
0.782104 |
NaN |
0.782104 |
| 2026-01-07 11:45:00+08:00 |
93 |
705 |
Ws_E44 |
0.479175 |
30 |
705.0 |
705.416667 |
705.57 |
707.166667 |
NaN |
NaN |
NaN |
3619.0 |
3725.0 |
34 |
-0.121422 |
-0.198611 |
-0.129009 |
0.362000 |
0.623529 |
21.2 |
25.0 |
95.8 |
21.2 |
0.0 |
0.314861 |
NaN |
0.314861 |
| 2026-01-07 12:55:00+08:00 |
93 |
775 |
Ws_E44 |
0.479175 |
30 |
775.0 |
775.416667 |
775.57 |
777.166667 |
NaN |
NaN |
NaN |
3620.0 |
3729.0 |
34 |
-0.112001 |
-0.169722 |
-0.104777 |
0.347333 |
0.641176 |
21.8 |
25.0 |
95.8 |
21.8 |
0.0 |
1.062772 |
NaN |
1.062772 |
| 2026-01-07 14:05:00+08:00 |
93 |
845 |
Ws_E44 |
0.479175 |
30 |
845.0 |
845.416667 |
845.57 |
847.250000 |
NaN |
NaN |
NaN |
3633.0 |
3744.0 |
34 |
-0.103337 |
-0.143611 |
-0.055109 |
0.356333 |
0.652941 |
22.2 |
25.0 |
100.8 |
22.2 |
0.0 |
1.527113 |
NaN |
1.527113 |